complexos acamadados da serra da onÇa e serra do puma...
TRANSCRIPT
UNIVERSIDADE DE BRASÍLIA - UNB
INSTITUTO DE GEOCIÊNCIAS - IG
COMPLEXOS ACAMADADOS DA SERRA DA ONÇA E
SERRA DO PUMA: GEOLOGIA E PETROLOGIA DE
DUAS INTRUSÕES MÁFICO-ULTRAMÁFICAS COM
SEQUENCIA DE CRISTALIZAÇÃO DISTINTA NA
PROVÍNCIA ARQUEANA DE CARAJÁS, BRASIL.
WOLNEY DUTRA ROSA
DISSERTAÇÃO DE MESTRADO Nº 331
Brasília
2014

UNIVERSIDADE DE BRASÍLIA - UNB
INSTITUTO DE GEOCIÊNCIAS - IG
COMPLEXOS ACAMADADOS DA SERRA DA ONÇA E
SERRA DO PUMA: GEOLOGIA E PETROLOGIA DE
DUAS INTRUSÕES MÁFICO-ULTRAMÁFICAS COM
SEQUENCIA DE CRISTALIZAÇÃO DISTINTA NA
PROVÍNCIA ARQUEANA DE CARAJÁS, BRASIL.
Wolney Dutra Rosa
Dissertação de Mestrado Nº 331
Orientador: Prof. Dr. Cesar Fonseca Ferreira Filho (IG-UnB)
Examinadores:
Prof. Dr. Cesar F. Ferreira Filho IG-UnB (orientador)
Prof. Dra. Juliana Charão Marques - IG-IFRGS (membro externo)
Prof. Dr. Massimo Matteini - IG-UnB (membro interno)
Prof. Dra. Catarina L. Toledo (membro interno - suplente)
Brasília, agosto de 2014

a
AGRADECIMENTOS
Ao professor Dr. Cesar F. Ferreira Filho, por toda dedicação, vontade em
transmitir seu conhecimento e comprometimento com o projeto de pesquisa;
À professora Dra. Sylvia Maria Araújo, pela revisão final no trabalho;
Ao professor Márcio M. Pimentel, pela ajuda com os estudos geocronológicos;
Ao Instituto de Geociências da Universidade de Brasília e seus professores, pela
base geológica na minha graduação e pelo suporte nas diversas análises deste projeto;
A Vale S/A pelo apoio na liberação dos dados e acesso as áreas;
Ao CNPq, IG-UnB e VALE pelo suporte no custeio e nas diversas etapas de
campo e laboratório deste projeto de pesquisa.
Aos meus gerentes Fernando Matos e Fernando Greco, por aprovar e apoiar o
projeto de pesquisa;
Aos geólogos e amigos de trabalho, em especial a Carlos Augusto Medeiros,
Rogerio Caron, Denisson Oliveira, Samuel Nunes e Cantidiano Freitas, pelo apoio em
campo, discussões e disposição em ajudar;
À geóloga e amiga, Juliana Araujo, por não medir esforços na hora de ajudar e
incentivar;
À geóloga e querida esposa, Rubia Schley, pela paciência, apoio incondicional,
toque de arte nas figuras e força para conseguir finalizar esse projeto;
A minha irmã, Hianny, e seu anjinho Felipe, que mesmo distante transformou a
vida de toda família;
Aos meus pais, José e Luzia, pela dedicação, amor, carinho e construção dos
meus valores como ser humano.
b
ÍNDICE
I - RESUMO ............................................................................................................. i
II - CONSIDERAÇÕES GERAIS
i. Introdução .............................................................................................. 01
ii. Localização e fisiografia ........................................................................ 02
iii. Justificativa e objetivos.......................................................................... 03
iv. Método .................................................................................................... 03
v. Escopo do estudo .................................................................................... 04
vi. Referências.............................................................................................. 05
III – SERRA DA ONÇA AND SERRA DO PUMA LAYERED COMPLEXES:
GEOLOGY AND PETROLOGY OF TWO INTRUSIONS WITH DISTINCT
CRYSTALIZATION SEQUENCES IN THE ARCHEAN CARAJÁS
PROVINCE, BRAZIL ............................................................................................. 07
Abstract ..................................................................................................................... 07
1. Introduction .......................................................................................................... 08
2. Exploration and Development History .............................................................. 09
3. Regional Setting ................................................................................................... 10
3.1. The Carajás Mineral Province ................................................................... 10
3.2. Layered intrusions ....................................................................................... 14
4. Analytical Procedures .......................................................................................... 17
4.1. Microprobe analyses .................................................................................... 17
4.2. Bulk rock lithochemical analyses ................................................................ 18
4.3. Sm-Nd isotopic analyses .............................................................................. 18
4.4. LA-ICPMS U-Pb zircon analyses ............................................................... 18

c
5. Serra da Onça Layered Mafic-Ultramafic Complex ........................................ 19
5.1. Geology and Petrography ............................................................................ 19
5.2. Mineral Chemistry ....................................................................................... 25
6. Serra do Puma Layered Mafic-Ultramafic Complex ....................................... 27
6.1. Geology and Petrography ............................................................................ 27
6.2. Mineral Chemistry ....................................................................................... 33
7. Bulk Rock Geochemistry ..................................................................................... 35
7.1. Major and Minor Elements......................................................................... 35
7.2. Trace Elements ............................................................................................. 39
8. U-Pb and Sm-Nd isotopes .................................................................................... 45
8.1. U-Pb geochronology ..................................................................................... 45
8.2. Sm-Nd systematics ....................................................................................... 47
9. Discussion.............................................................................................................. 49
9.1. Parental Magma ........................................................................................... 49
9.2. Assimilation .................................................................................................. 50
9.3. The petro-tectonic setting of the Serra da Onça and Serra do Puma
layered complexes .................................................................................................... 52
9.4. The potential for Ni-Cu-PGE deposits ....................................................... 56
10. Conclusions ......................................................................................................... 56
Acknowledgments .................................................................................................... 58
References ................................................................................................................. 58
IV. CONCLUSÕES.................................................................................................. 64
ANEXOS ................................................................................................................... ...I

d
ÍNDICE DE FIGURAS
Figura i .1 – Mapa de localização da área com principais drenagens e modelo digital
de terreno. .................................................................................................................. 02
Figura 1 – A) Location of the Carajás Mineral Province. B) Geological map of
Carajás Mineral Province (Modified from CPRM 2008). The area of the Serra da
Onça and Serra do Puma complexes (indicated in the map) is detailed in figures 2 and
3.................................................................................................................................. 13
Figura 2 – Geological map of the area of the Serra da Onça and Serra do Puma
complexes (partially modified from Vale's unpublished internal reports) ................ 16
Figura 3 – Analytical signal amplitude of the area indicated in Fig. 2 (partially
modified from Vale's unpublished internal reports). Dashed lines indicate mapped
mafic-ultramafic intrusions. ....................................................................................... 17
Figura 4 – Geological map and section of the Serra da Onça Complex. .................. 20
Figura 5 – A) View from north to south of the Serra da Onça Complex. The hill
correspond to the base of the UZ. The LBG forms a narrow zone at the base of the
hill. B) Weathered medium-grained adcumulate dunite of the UZ. C)
Photomicrograph of medium-grained dunite. The sample consists of serpentinized
olivine (Ol) and euhedral chromite (opaques). D) Photomicrograph of plagioclase
orthopyroxenite of the UZ. The sample consists of cumulus Opx and intercumulus
plagioclase (Pl). E) Photomicrograph of norite of the MZ. The sample is an Opx and
plagioclase (Pl) cumulate with minor intercumulus Cpx (anhedral crystals with higher
birefringence). F) Gabbronorite of the MZ. The sample is an adcumulate with
cumulus Opx, Cpx and plagioclase (Pl) ..................................................................... 22
Figura 6 – Stratigraphy of the Serra da Onça Complex. ........................................... 24
Figura 7 – Compositional variation of olivine, orthopyroxene and plagioclase
throughout the stratigraphy of the SOC ..................................................................... 25
Figura 8 – Plot of Fo versus Ni content of olivine of the SOC. The dashed line is the
compositional trend for olivine from layered complexes (Simkin and Smith, 1970) 26
Figura 9 – Geological map and section of the Serra do Puma Complex .................. 28
Figura 10 – A) View from south to north of the Serra do Puma Complex. The hill
correspond to the UZ. The boulders in the front view consist of gabbro from the upper
portion of the LZ. B) Layered gabbro of the LZ. C) Elongated xenolith of gabbro
within peridotite of the LZ. D) Photomicrograph of olivine clinopyroxenite with

e
adcumulate textute of the LZ. The sample consists of cumulus Cpx and olivine (Ol) .
E) Photomicrograph of clinopyroxenite of the UZ. The sample is an Cpx cumulate
with minor intercumulus plagioclase (Pl). F) Gabbro of the LZ with igneous
lamination. The sample is an adcumulate with cumulus Cpx and plagioclase (Pl). .. 31
Figura 11 – Stratigraphy of the Serra do Puma Complex ......................................... 32
Figura 12 – Compositional variation of olivine, clinopyroxene and plagioclase
throughout the stratigraphy of the SPC ...................................................................... 34
Figura 13 – Plot of Fo versus Ni content of olivine of the SPC. The dashed line is the
compositional trend for olivine from layered complexes (Simkin and Smith, 1970) 34
Figura 14 – Plot of Mg# versus selected major and minor element contents for rocks
of the Serra da Onça and Serra do Puma complexes. Data from Table 1 and Table 2
.................................................................................................................................... 38
Figura 15 – Plot of MgO versus CaO contents for pyroxenites and gabbroic rocks of
the Serra da Onça and Serra do Puma complexes. Data from Table 1 and Table 2.
Field of plagioclase is based upon microprobe data for cumulus plagioclase from both
complexes (reported in this study). Thick solid lines indicate the cristalization
sequence for the SOC (bluish color) and SPC (reddish color) complexes ................ 39
Figura 16 – Primitive mantle-normalized REE profiles for samples of the SOC and
SPC. A) Samples of gabbroic rocks. B) Samples of pyroxenites. C) Samples of
peridotites. Data from Tables 1 and 2. Primitive mantle normalization values are from
Sun and McDonough (1989) ...................................................................................... 41
Figura 17 – Gd/Yb vs La/Sm plot for gabbroic rocks of the SOC and SPC. Same
samples plotted in Fig. 16A ....................................................................................... 42
Figura 18 – La/Sm vs Ce and La/Sm vs Yb plots for gabbroic rocks of the SOC and
SPC. Same samples plotted in Fig. 16A .................................................................... 43
Figura 19 – Primitive mantle-normalized alteration-resistant trace elements profiles
for samples of gabbroic rocks of the SOC and SPC. Data from Tables 1 and 2.
Primitive mantle normalization values are from Sun and McDonough (1989) ......... 44
Figura 20 – LA-MC-ICPMS U-Pb plot for sample SC68. See text for explanation 46
Figura 21 – εNd (T=2.77 Ga) vs Ce/Nb, εNd (T=2.77 Ga) vs La/Sm and εNd
(T=2.77 Ga) vs MgO plots for rocks of the SOC and SPC. Data from Table 01, 02 and
04................................................................................................................................ 48
Figura 22 – Summary of U-Pb zircon ages, Fo contents of olivine and Sm-Nd
isotopes for layered intrusions of the CMP. Data from the following references: Lago

f
Grande (Teixeira, 2013; Teixeira et al., submitted); Luanga (Machado et al., 1991;
Ferreira Filho et al., 2007); Luanga and Puma (this study), Grão Pará (Machado et al.
1991; Trendall et al., 1998) ........................................................................................ 53
Figura 23 – A) Analytical signal image for the CMP (geophysical data processes
from PGBC and Carajás 1 regional surveys). B) Geological map of the CMP (see
captions in Fig. 1) ...................................................................................................... 55
ÍNDICE DE TABELAS
Tabela 01 – Whole-rock analyses of representative samples from the Serra da Onça
Complex
.................................................................................................................................... 36
Tabela 02 – Whole-rock analyses of representative samples from the Serra do Puma
Complex ..................................................................................................................... 37
Tabela 03 – U-Pb LA-MC-ICPMS data for sample SC68........................................ 46
Tabela 04 – Sm–Nd isotopic data for the SOC and SPC ......................................... 47

i
RESUMO
Os complexos máficos-ultramáficos da Serra da Onça e Serra do Puma estão
localizados na porção SW da Província Mineral de Carajás (PMC), um dos mais
importantes distritos minerais do Brasil, conhecida por abrigar várias intrusões
acamadadas que possuem significantes recursos de níquel laterítico. É resultado deste
estudo, a primeira caracterização detalhada destas duas intrusões na porção ocidental
da PMC, que indicam uma evolução magmática notavelmente diferente para os
Complexos da Serra da Onça (CSO) e Complexo da Serra do Puma (CSP). A
geologia do CSO foi previamente descrito por Macambira (1997) e Macambira e
Ferreira Filho (2002). A CSO é uma intrusão de direção EW, com 24 km de
comprimento e aproximadamente 3,5 km de largura. A estratigrafia da CSO consiste
em um grupo de borda inferior (GBI), zona ultramáfica (ZU) e zona máfica (ZM). O
GBI localizado na porção norte da intrusão, forma uma estreita e descontinua camada
constituída por gabronoritos (Opx+Cpx+Pl cúmulus). A ZU forma uma serra
alongada e é constituída principalmente por dunitos (Ol+Chr) e camadas de
ortopiroxenitos (Opx+Chr). A sequência de cristalização da ZU consiste em Ol+Chr;
Ol+Opx+Chr; Opx+Chr e Opx. A ZM abrange metade de toda área exposta da CSO e
consiste em sua maioria de gabronoritos (Opx+Cpx+Pl). As rochas mais fracionadas
da ZM consistem em camadas pouco espessas de ilmenita-magnetita gabronorito
(Pig+Cpx+Pl+Mag+Ilm cúmulus). A sequencia de cristalização da ZM é Opx+Pl;
Opx+Pl+Cpx; Pig+Pl+Cpx e Pig+Pl+Cpx+Mag+Ilm. O Complexo da Serra do Puma
(CSP) é uma intrusão acamadada de direção SW-NE com aproximadamente 25 km de
comprimento por 3 km de largura. Sua estratigrafia é formada por um grupo de borda
inferior (GBI), zona ultramáfica (ZU) e zona acamadada (ZA). O GBI forma uma
zona distinta formada por gabros (Cpx+Pl) na borda norte da CSP. A ZU forma uma
serra alongada e é constituída principalmente por dunitos (Ol+Chr) com menores
intercalações de peridotitos com Ol+Chr cúmulus ou Ol+Cpx+Chr, e variáveis
proporções de Cpx+Opx+Pl intersticial, camadas descontinuas e pouco espessas de
clinopiroxenito (Cpx cúmulus). A ZA é formada principalmente por gabros (Cpx+Pl)
com inúmeras intercalações de peridotitos e em menor proporção clinopiroxenitos
(Cpx+Pl). Pequenas lentes de magnetita gabro pegmatoide, interpretado como porções
enriquecidas em líquido residual fracionado preso dentro da ZA. A sequencia de
cristalização para CSP é formada por Ol+Chr, Ol+Cpx+Chr, Ol+Cpx, Cpx e Cpx+Pl.

ii
Sequencias de cristalização distintas para CSO (Ol+Chr > Opx+Chr > Opx > Opx+Pl
> Opx+Pl+Cpx) e CSP (Ol+Chr > Ol+Cpx+Chr > Cpx > Cpx+Pl) indica que eles
seguem diferentes linhas de cristalização do líquido magmático. A cristalização de
Opx primeiro do que Cpx no CSO indica um magma primário saturado em sílica, no
caso do CSP onde ocorre apenas a cristalização de Cpx como fase cúmulus, o magma
parental deve ser insaturado em sílica. Uma composição muito primitiva (com alto
conteúdo de MgO) para o magma parental da CSO e CSP é indicado pela abundância
de dunitos e peridotitos (cerca de 50% nos dois complexos). O elevado conteúdo de
MgO e de Ni é muito semelhante para os dunitos que são a base do minério laterítico
dos dois depósitos. O range de composição dos cúmulus de Ol na ZU para o CSO
(Fo86.2-92.4) e CSP (Fo88.6-87.7) suporta a interpretação da composição muito primitiva
para o magma parental. A composição mais primitiva Fo92 dos cúmulus de Ol são
comparáveis com as reportadas para o Great Dyke (Fo92; Wilson, 1982), Niquelândia
Complex (Fo93; Ferreira Filho & Araújo, 2009; Ferreira Filho et al. 2010) e Ipueira-
Medrado Sill (Fo93; Marques & Ferreira Filho, 2003), todos originados de magmas
parentais muito primitivo. Perfis de elementos incompatíveis e traços, normalizados
ao manto, de rochas gabroicas do CSO e CSP, mostram relativo enriquecimento em
ETRL e Th, com anomalias negativas de Nb e Ta. A distribuição destes elementos
traços é consistente com uma mistura de fusão de manto primitivo com crosta
continental. A similaridade entre os perfis de elementos incompatíveis e traços da
CSO e CSP sugere que as rochas cumuláticas dos dois complexos cristalizaram a
partir de um magma parental similar em conteúdo de elementos incompatíveis.
Evidências adicionais de contaminação crustal são fornecidas pelos dados isotópicos
de Sm-Nd, onde o CSP tem valores de εNd (T=2.77 Ga) = -3,56 a 2,41 e o CSO com εNd
(T=2.77 Ga) = -3,33 a -2,12. O fato do CSO ter valores menos variáveis e mais negativos
de εNd (T=2.77 Ga) e ligeiro aumento nas razões La/Sm e Ce/Nb quando comparados as do
CSP, indica uma maior contaminação crustal para o CSO. A combinação de todos os
dados sugere que as composições de acordo com os magmas parentais do CSO e CSP
foram derivados a partir de uma fonte semelhante, seguindo por uma contaminação
variável por rochas da crosta, que é mais significativa no CSO. Dados de U-Pb em
zircões ígneos, proveniente de uma magnetita gabro pegmatoide do CSP, indicaram
uma idade de cristalização de 2713±30 Ma, que reforça um importante evento
magmático Neoarqueno (2,76 Ga) para a PMC. Estas idades são correlatas ao
vulcanismo bimodal do Grupo Grão Pará (2759±2 Ma, Machado et al., 1991;

iii
2760±11 Ma, Trendall et al., 1998) apoiando assim a interpretação de que as rochas
vulcânicas máficas e as intrusões máfica-ultramáficas resultaram de eventos coevos
(Machado et al., 1991; Ferreira Filho et al., 2007). As grandes intrusões máfica-
ultramáficas da CMP estão encaixadas em descontinuidades crustais profundas, que
permitem a ascensão das intrusões acamadadas. Durante o processo de ascensão
variáveis conteúdos de crosta continental mais antiga são assimilados, isso é esperado
se o magmatismo máfico-ultramáfico em Carajás está associado com o rifteamento
intra-placa de crosta mais antiga (Gibbs et al., 1986; Olszewski et al., 1989; Villas &
Santos, 2001).

iv
ABSTRACT
The mafic-ultramafic complexes of the Serra da Onça and Serra do Puma are
located in the SW portion of the Carajás Mineral Province (CMP), one of the most
important mineral districts of Brazil, known for hosting several layered intrusions that
have significant lateritic nickel resources. It is the result of this study, the first detailed
characterization of these two intrusions in the western portion of CMP, indicating a
remarkably different magmatic evolution for the Serra da Onça Complexe (SOC) and
Serra do Puma Complex(SPC).
The geology of the CSO was previously described by Macambira (1997) and
Macambira and Ferreira Filho (2002). The SOC is an intrusion of EW direction, 24
km long and approximately 3.5 km wide. The stratigraphy of the SOC consists of a
lower border group (LBG), ultramafic zone (UZ) and mafic zone (MZ). The LBG
located in the northern portion of the intrusion, form a narrow and discontinuous layer
consisting of gabbronorites (Opx + Cpx + Pl cumulus). The UZ form an elongated hill
and is composed mainly of dunites (Ol + Chr) and orthopyroxenites layers (Opx +
Chr). The sequence of crystallization of the UZ consists of Ol+Chr; Ol+Opx+Chr;
Opx+Chr and Opx. The UZ covers half of the entire SOC exposed area and is
characterized mostly by gabbronorites (Opx+Cpx+Pl). The most fractionated rocks of
the MZ consist on slightly thick layers of ilmenite-magnetite gabbronorite
(Pig+Cpx+Pl+Mag+Ilm cmulus). The crystallization sequence of the MZ is Opx+Pl;
Opx+Pl+Cpx; Pig+Pl+Cpx and Pig+Pl+Cpx+Mag+Ilm. The Serra do Puma Complex
(SPC) is a layered intrusion of SW-NE direction with approximately 25 km long by 3
km wide. The stratigraphy of this complex is formed by a lower border group (LBG),
ultramafic zone (UZ) and layered zone (LZ). The LBG forms a distinct zone
constituted by gabbros (Cpx + Pl) on the northern edge of the SPC. The UZ forms an
elongated hill and is composed mainly by dunites (Ol+Chr) with minor peridotites
intercalations with Ol+Chr cumulus or Ol+Cpx+Chr, and variable proportions of
interstitial Cpx + Opx + Pl, discontinuous and slightly thick layers of clinopyroxenite
(Cpx cumulus). The LZ is primarily composed of gabbros (Cpx + Pl) with
innumerable intercalations of peridotites and clinopyroxenites in lower proportion
(Cpx + Pl). Small lenses of magnetite gabbro pegmatoid are interpreted as portions
enriched in fractionated residual liquid trapped inside the LZ. The crystallization
sequence for the SPC is comprised of by Ol + Chr, Ol + Cpx + Chr, Ol + Cpx, Cpx

v
and Cpx + Pl. Distinct crystallization sequences for the SOC (Ol+Chr > Opx+Chr >
Opx > Opx+Pl > Opx+Pl+Cpx) and the SPC (Ol + Chr> Ol + Cpx + Chr> Cpx> Cpx
+ Pl>) indicates that they follow different processes of magmatic liquid
crystallization. The crystallization of Opx, first of Cpx in the SOC indicates a primary
magma saturated in silica, in the case of the SPC, where occurs only the Cpx
crystallization as cumulus phase, the parental magma should be unsaturated in silica.
A very primitive composition (with high MgO contents) for the parental magma of
the SOC and the SPC is indicated by the abundance of dunites and peridotites (about
50% in both complexes). The high content of MgO and Ni is very similar to dunites
which are the basis of the lateritic ore for both deposits. The composition range of Ol
cumulus in UZ for the SOC (Fo86.2-92.4) and the SPC (Fo88.6-87.7) supports the
interpretation of the very primitive composition for the parental magma. The most
primitive composition Fo92 of Ol cumulus are comparable with those reported for the
Great Dyke (Fo92; Wilson, 1982), Niquelândia Complex (Fo93; Ferreira Filho &
Araújo, 2009; Ferreira Filho et al. 2010) and Ipueira-Medrado Sill (Fo93; Marques &
Ferreira Filho, 2003), all originated from very primitive parental magmas. Profiles of
incompatible elements and normalized to the mantle traces of the SOC and SPC
gabbroic rocks, show relative enrichment in LREE and Th, with negative anomalies
of Nb and Ta. The distribution of these trace elements is consistent with a fusion
blend of primitive mantle and continental crust. The similarity between the profiles of
incompatible elements and traces of the SOC and the SPC suggests that the cumulate
rocks of both complexes crystallize from a similar parental magma regarding the
contents of incompatible elements. Additional evidence of crustal contamination is
provided by Sm-Nd isotopic data, where the SPC shows values of εNd (T=2.77 Ga) =
-3.56 to 2.41 and the SOC presents εNd (T=2.77 Ga) = -3.33 to -2.12. The fact that
the SOC have lower variable values and more negative values of εNd (T=2.77 Ga)
and slight increase in La/Sm and Ce/Nb ratios compared to the SPC, indicates a
greater crustal contamination to the SOC. The combination of all data suggests that
the compositions, according to the parental magmas of the SOC and the SPC, were
derived form a similar source, followed with a variable contamination by crustal
rocks, which is more significant in the SOC. U-Pb data in igneous zircons from a
magnetite gabbro pegmatoid of the SPC, indicated a crystallization age of 2713±30
Ma, which reinforces an important Neoarchean (2.76 Ga) magmatic event for the
CMP. These ages correlate to the bimodal volcanism of the Grão Pará Group (2759±2

vi
Ma, Machado et al., 1991; 2760±11 Ma, Trendall et al., 1998) supporting the
interpretation that the mafic volcanic rocks and mafic-ultramafic intrusions resulted
from coeval events (Machado et al., 1991; Ferreira Filho et al., 2007). Mafic-
ultramafic large intrusions of the CMP are embedded in deep crustal discontinuities,
allowing the ascension of the layered intrusions. During the ascension process,
variable contents of oldest continental crust are assimilated, and this is expected if the
mafic-ultramafic magmatism in Carajás is associated with the older crust intraplate
rifting (Gibbs et al., 1986; Olszewski et al., 1989; Villas & Santos, 2001).

1
CONSIDERAÇÕES GERAIS
Introdução
A pesquisa realizada está inserida no Projeto Integrado de Pesquisa do
coordenador, “Desenvolvimento de parâmetros comparativos da fertilidade do
magmatismo máfico-ultramáfico de Carajás para mineralizações magmáticas
(Ni, Cu, EGP, Cr, Ti-V) com base em estudos geocronológicos, petrológicos e do
seu posicionamento tectônico-estratigráfico”, aprovado no Edital
MCT/CTMineral/VALE/CNPq 12/2009, com recursos liberados em 08/2010. O
projeto está inserido da Linha Temática: “Desenvolver metodologias de exploração
geológica de suporte à exploração mineral voltados às especificidades do
ambiente geológico do Brasil com a finalidade de contribuir para aprimorar e
ampliar o conhecimento geológico do subsolo brasileiro”, e conta com a parceria
da VALE S/A.
A exploração mineral em Carajás está chegando a um nível de maturidade
que, a exemplo do que ocorre em outras províncias minerais do planeta, demanda
novas metodologias tecnológicas e geológicas (ou conceituais) de exploração. Os
depósitos magmáticos associados a magmas máficos e máfico-ultramáficos (UMU),
incluindo Ni, Cu, EGP, Cr e Ti-V são originados a partir de processos petrológicos
inerentes a estes magmas. Em vista disso a fertilidade ou probabilidade relativa dos
complexos MUM para hospedar depósitos magmáticos pode ser estabelecida a partir
de suas características petrológicas. Critérios petrológicos, geralmente associados a
suítes específicas de magmas MUM, constituem a principal ferramenta de exploração
indireta utilizada na prospecção direcionada a depósitos magmáticos de Ni-Cu-EGP-
Cr-Ti-V.
Trabalhos de mapeamento geológicos diversos, incluindo os programas de
levantamento geológico da CPRM e aqueles desenvolvidos por empresas de
exploração mineral, indicam que associações MUM são abundantes na região de
Carajás. Trabalhos geocronológicos e petrológicos são ainda muito restritos e estão
em descompasso com o atual conhecimento geológico disponível. Na ausência destes
trabalhos as propostas para definição de diferentes suítes MUM na região de Carajás
são especulativas e passíveis de conduzir a interpretações equivocadas. O programa
prospecção mineral para depósitos magmáticos de EGP e Ni-Cu desenvolvidos pela
VALE em Carajás, especialmente nos últimos 10 anos, permitem estabelecer

2
características geológicas-estratigráficas de várias associações MUM. Estes resultados
sugerem uma complexidade e diversidade de associações MUM bem maior do que é
reconhecido atualmente em trabalhos publicados.
Localização e fisiografia
A área de pesquisa abrange os complexos máfico-ultramáficos da serra do Puma
e Onça, localizados no sudoeste do Estado do Pará, no norte do Brasil. A menor
distância entre eles, em linha direta é de 8,5 km, por estrada, 13,5 km.
A parte ocidental do Complexo Puma está no município de Parauapebas. Seus dois
terços orientais estão dentro da Reserva Indígena Cateté. A metade ocidental do
Complexo Onça está localizada no município de São Félix do Xingú. A metade
oriental no município de Ourilândia do Norte.
Figura i.1 – Mapa de localização da área com principais drenagens e modelo digital de terreno.
3
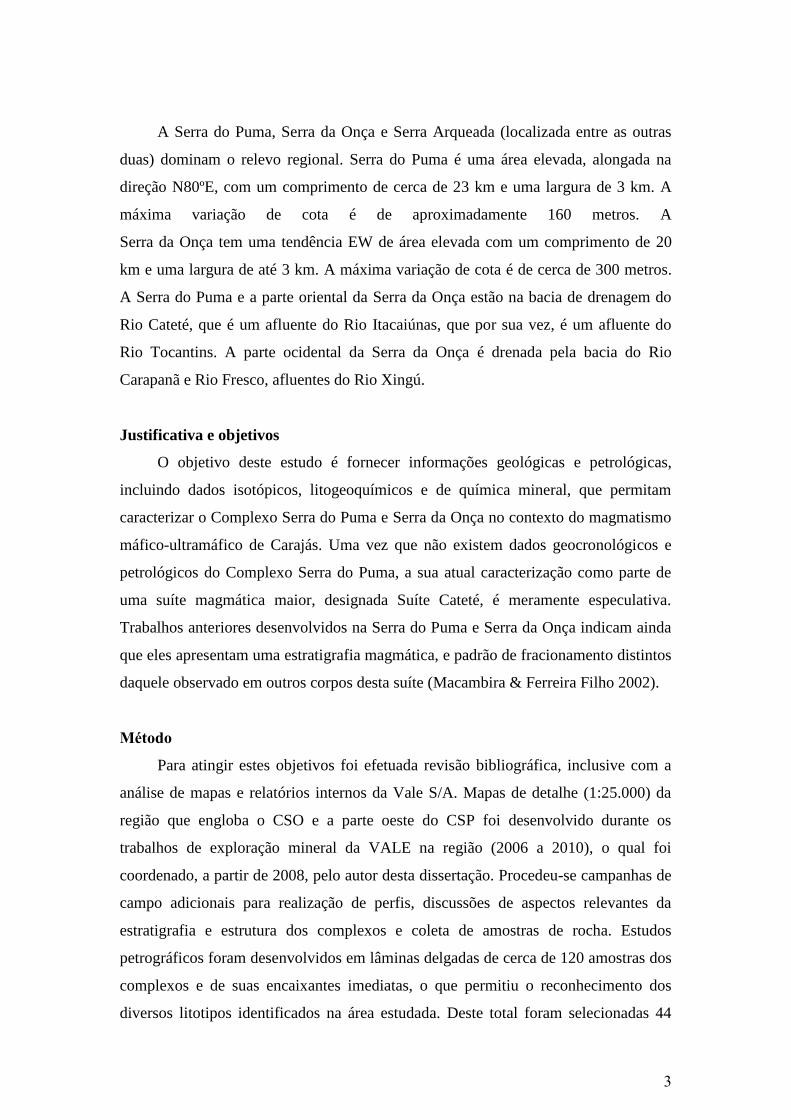
A Serra do Puma, Serra da Onça e Serra Arqueada (localizada entre as outras
duas) dominam o relevo regional. Serra do Puma é uma área elevada, alongada na
direção N80ºE, com um comprimento de cerca de 23 km e uma largura de 3 km. A
máxima variação de cota é de aproximadamente 160 metros. A
Serra da Onça tem uma tendência EW de área elevada com um comprimento de 20
km e uma largura de até 3 km. A máxima variação de cota é de cerca de 300 metros.
A Serra do Puma e a parte oriental da Serra da Onça estão na bacia de drenagem do
Rio Cateté, que é um afluente do Rio Itacaiúnas, que por sua vez, é um afluente do
Rio Tocantins. A parte ocidental da Serra da Onça é drenada pela bacia do Rio
Carapanã e Rio Fresco, afluentes do Rio Xingú.
Justificativa e objetivos
O objetivo deste estudo é fornecer informações geológicas e petrológicas,
incluindo dados isotópicos, litogeoquímicos e de química mineral, que permitam
caracterizar o Complexo Serra do Puma e Serra da Onça no contexto do magmatismo
máfico-ultramáfico de Carajás. Uma vez que não existem dados geocronológicos e
petrológicos do Complexo Serra do Puma, a sua atual caracterização como parte de
uma suíte magmática maior, designada Suíte Cateté, é meramente especulativa.
Trabalhos anteriores desenvolvidos na Serra do Puma e Serra da Onça indicam ainda
que eles apresentam uma estratigrafia magmática, e padrão de fracionamento distintos
daquele observado em outros corpos desta suíte (Macambira & Ferreira Filho 2002).
Método
Para atingir estes objetivos foi efetuada revisão bibliográfica, inclusive com a
análise de mapas e relatórios internos da Vale S/A. Mapas de detalhe (1:25.000) da
região que engloba o CSO e a parte oeste do CSP foi desenvolvido durante os
trabalhos de exploração mineral da VALE na região (2006 a 2010), o qual foi
coordenado, a partir de 2008, pelo autor desta dissertação. Procedeu-se campanhas de
campo adicionais para realização de perfis, discussões de aspectos relevantes da
estratigrafia e estrutura dos complexos e coleta de amostras de rocha. Estudos
petrográficos foram desenvolvidos em lâminas delgadas de cerca de 120 amostras dos
complexos e de suas encaixantes imediatas, o que permitiu o reconhecimento dos
diversos litotipos identificados na área estudada. Deste total foram selecionadas 44

4
amostras distribuídas em seções representativas de cada complexo, as quais
forneceram material para as diversas metodologias analíticas utilizadas neste estudo.
As análises químicas de mineral via microssonda eletrônica foram realizadas no
Laboratório de Microssonda Eletrônica da Universidade de Brasília, em equipamento
JEOL JXA-8230. Foram analisados de forma sistemática cristais de olivina,
ortopiroxênio, clinopiroxênio, e plagioclásio. O tratamento dos dados foi feito por
meio de planilha eletrônica Excel e os resultados analíticos encontram-se no Anexo
01.
A preparação e análise de amostras para litogeoquímica foram realizadas no
Laboratório ActLab, usando método convencional para elementos maiores (FRX) e
elementos traço (ICP-MS). Uma descrição completa dos métodos analíticos está
disponível na pagina da internet: ActLab (www.actlabs.com). Um total de 44
amostras representativas de afloramentos foram analisadas. Os resultados para estas
amostras são apresentados na Tabela 01 (Complexo da Serra da Onça) e Tabela 02
(Complexo da Serra do Puma).
Para este trabalho foram realizadas 15 análises isotópicas Sm–Nd (tabela 04)
segundo método descrito por Gioia & Pimentel (2000) no Laboratório de
Geocronologia da Universidade de Brasília.
Para as analises de U-Pb em zircões foram obtidos concentrados minerais pelo
uso de técnicas convencionais e seleção manual com lupa binocular. As análises U-Pb
LA-ICPMS seguiram o procedimento analítico descrito por Buhn et al. (2009) e
foram realizadas no Laboratório de Geocronologia da Universidade de Brasília. Grãos
de zircão com 206
Pb/204
Pb inferiores a 1000 foram rejeitadas. Os dados foram plotados
utilizando ISOPLOT v.3 (Ludwig, 2001) e os erros para as razões isotópicas são
apresentados ao nível 2σ. Resultados de U-Pb para amostra SC68 (Puma) estão
apresentados na Tabela 3.
Escopo do estudo
Conforme previsto no regulamento do Curso de Pós-graduação em Geologia da
Universidade de Brasília e por sugestão do Orientador, esta dissertação de mestrado
apresenta-se estruturada na forma de artigo à ser submetido para publicação em
periódico com corpo editorial. O artigo é apresentado na forma que será submetido,
mantendo o estilo e o formato previstos no periódico.
O artigo, intitulado “Serra da Onça and Serra do Puma layered complexes:

5
geology and petrology of two intrusions with distinct crystallization sequences in
the archean Carajás province, Brazil.” foi elaborado durante o ano de 2014 e será
submetido à revista Applied Earth Sciences - Institution of Mining and Metallurgy
Este artigo tem como objetivo principal fornecer informações geológicas e
petrológicas, incluindo dados isotópicos, litogeoquímicos e de química mineral, que
permitam caracterizar o Complexo Serra do Puma e Serra da Onça no contexto do
magmatismo máfico-ultramáfico de Carajás.
Referências
Buhn B., Pimentel M.M., Matteini M., Dantas E.L. 2009. High spatial resolution
analysis of Pb and U isotopes for geochronology by laser ablation multi-collector
inductively coupled plasma mass spectrometry (LAMC- ICP-MS). Anais da
Acad. Bras. de Ciências, 1:1-16.
Ferreira Filho, C.F., Araujo, S.M., 2009. Review of Brazilian chromite deposits
associated with layered intrusions: geological and petrological constraints for the
origin of stratiform chromitites: Applied Earth Sciences (Trans. Inst. Min. Metall.
B), v. 118, 86-100.
Ferreira Filho, C.F., Cançado, F., Correa, C., Macambira, E.M,B., Siepierski, L.,
Junqueira-Brod, T. C. 2007. Mineralizações estratiformes de EGP-Ni associadas
a complexos acamadados em Carajás: os exemplos de Luanga e Serra da Onça, in
Contribuições à Geologia da Amazônia, Sociedade Brasileira de Geologia -
Núcleo Norte, 01-14.
Ferreira Filho, C.F., Pimentel, M.M., Araujo, S.M., and Laux, J.H., 2010. Layered
intrusions and volcanic sequences in Central Brazil: Geological and
geochronological constraints for Mesoproterozoic (1.25 Ga) and Neoproterozoic
(0.79 Ga) igneous associations. Precambrian Research, v. 183, p. 617−634.
Gibbs, A.K., Wirth, K.R., Hirata, W.K., Olszewski Jr, W.J. 1986. Age and
composition of the Grão Pará Group volcanics, Serra dos Carajás: Revista
Brasileira de Geociências, 201-211.
Gioia, S.M.C.L., Pimentel, M.M., 2000. The Sm-Nd isotopic method in the
Geochronology Laboratory of the University of Brasília. Anais Academia
Brasileira de Ciências 72, 219-245.
Ludwig, K.R., 2001. Users Manual for Isoplot/Ex version 2.47. A geochronological

6
toolkit for Microsoft Excel. Berkeley Geochronology Center Special Publication
1a, 55p.
Macambira E.M.B. and Ferreira Filho C.F., 2002. Fracionamento Magmático dos
Corpos Máfico-Ultramáficos da Suíte Intrusiva Cateté – Sul do Pará. In: Klein
E.L., Vasquez M.L. & Rosa Costa L.T. (eds.) Contribuições à Geologia da
Amazônia v. 3. SBG-Núcleo Norte, pp. 105-114.
Macambira, E.M.B. 1997. Geologia e aspectos metalogenéticos dos elementos do
Grupo Platina no Complexo Máfico-ultramáfico da Serra da Onça, Sul do Pará.
Tese de Mestrado. Universidade Federal do Pará – UFPA, Pará, Brasil.
Machado, W., Lindenmayer, Z.G., Krogh, T.E., and Lindenmayer, D. 1991. U-Pb
geochronology of Archean magmatism and basement reactivation in the Carajás
area, Amazon shield, Brazil. Precambrian Research, 329-354.
Marques, J.C. and Ferreira Filho, C.F., 2003. The chromite deposits of the Ipueira-
Medrado Sill, Bahia, Brazil. Economic Geologt, v. 98, 87-108.
Olszewski, W.J., Wirth, K.R., Gibbs, A.K. and Gaudette, H.E., 1989. The age, origin,
and tectonics of the Grão Pará Group and associated rocks, Serra dos Carajás,
Brazil: Archean continental volcanism and rifting. Precam. Res. 42, 229–254.
Trendall, A.F., Basei, M.A.S., De Laeter, J.R. and Nelson, D.R., 1998. SHRIMP
zircon U-Pb constraints on the age of the Carajás Formation, Grão Pará Group,
Amazon Craton. J. South Am. Earth Sci. 11, 265–277.
Villas, R.N. and Santos, M.D., 2001. Gold deposits of the Carajás Mineral Province:
deposit types and metallogenesis. Miner. Deposita 36, 300–331.
Wilson, A.H., 1982. The Geology of the Great ‘Dyke’, Zimbabwe: The Ultramafic
Rocks’. Journl of Petrology, v. 23, p. 240–292.

7
To be submitted: Applied Earth Sciences - IMM
SERRA DA ONÇA AND SERRA DO PUMA LAYERED COMPLEXES:
GEOLOGY AND PETROLOGY OF TWO INTRUSIONS WITH DISTINCT
CRYSTALLIZATION SEQUENCES IN THE ARCHEAN CARAJÁS
PROVINCE, BRAZIL.
Wolney Dutra Rosa, Cesar F. Ferreira Filho and Márcio Martins Pimentel
Abstract
The Serra da Onça (SOC) and Serra do Puma (SPC) mafic-ultramafic
complexes are located in the SW portion of the Carajás Mineral Province (CMP), the
most important mineral district of Brazil. Despite the geographical proximity and
similarity in tectonic environment, these complexes have different sequences of
magmatic crystallization. The SOC follows a crystallization sequence consisting of
Ol+Chr > Opx+Chr > Opx > Opx+Pl > Opx+Pl+Cpx, whereas the crystallization
sequence of the SPC consists of Ol+Chr > Ol+Cpx+Chr > Cpx > Cpx+Pl. The
compositional range of cumulus Ol within the UZ of the SOC (Fo86.2-92.4) and the SPC
(Fo88.6-87.7) supports a very primitive composition for their parental magmas. The
early crystallization of Opx relative to Cpx in the SOC indicates that the primary
magma was silica saturated, whereas the absence of Opx as a cumulus mineral in the
SPC suggests that the primary magma was silica undersaturated. Very similar mantle-
normalized lithophile trace element profiles for the SOC and SPC rocks suggest that
cumulate rocks from both complexes crystallized from parental magmas with similar
contents of incompatible elements. Mantle-normalized negative Nb and Ta anomalies
characterize both the SOC and SPC, but are more significant for the SOC compared to
the SPC. These features may reflect the relative enrichment of LREE associated with
larger amounts of Cpx in samples of the SOC compared with those of the SPC. Both
complexes have highly variable negative values of εNd (T = 2.77 Ga), but gabbroic
rocks of the SOC (εNd (T = 2.77 Ga) = -3.33 to - 2.12) are more negative and less
variable than the values for gabbroic rocks of the SPC (εNd (T=2.77 Ga) = -2.47 to
2.41). The combination of all data suggests that the composition of the SOC and SPC
parental primitive magmas were derived from similar source, followed by variable
crustal contamination. Neoarchean ages reported for layered intrusions in the eastern

8
portion of the Carajás Mineral Province (e.g. Luanga and Lago Grande) overlap with
the age of the bimodal volcanism of the Grão Pará Group (e.g. 2759±2 Ma; 2760±11),
thus supporting the interpretation that mafic volcanics and mafic-ultramafic layered
intrusions resulted from coeval magmatic events. The 2713±30 Ma age reported for
the SPC in this study is younger than the ages reported for the Grão Pará Group, as
well as the Luanga complex, thus indicating a relatively younger intrusive event in the
western portion of the CMP. Crustal contamination is expected for high temperature
and Mg-rich magmas, such as the parental magmas of the SOC and SPC, which
intruded into gneisses and migmatites of the ca. 3.0 Ga Xingu Complex. Results are
also compatible with a higher proportion of crustal contamination for layered rocks of
the SOC compared with those of the SPC. The abundance of different types primitive
crustal contaminated layered intrusions in the CMP indicates a high potential for
magmatic Ni-Cu-PGE deposits. Considering that previous exploration for Ni-Cu-PGE
deposits mainly targeted exposed large layered intrusions, future exploration should
move toward smaller or covered to poorly exposed intrusions.
Keywords: Layered intrusion, crystallization sequence, U-Pb and Sm-Nd isotopes,

9
1 Introduction
The Carajás Mineral Province (CMP) is known for hosting numerous large
layered intrusions that host significant resources of lateritic nickel. These layered
intrusions were identified during mineral exploration projects or regional studies
carried out since the early 1970's (Araújo and Maia, 1991; Macambira and Vale,
1997). However, detailed petrological and geochronological studies of these layered
intrusions are relatively scarce, and so far restricted to the Luanga (Machado et al.,
1991; Diella et al., 1995; Ferreira Filho et al., 2007) and Lago Grande (Teixeira,
2013; Teixeira et al., submitted) complexes, all of them located in the eastern portion
of the CMP. These layered intrusions have Neoarchean ages that overlap with the ca.
2.75 Ga extensive basaltic magmatism of the CMP, confirming previous
interpretation by Machado et al. (1991) based on age dating of the Luanga Complex.
The abundance of layered intrusions, together with their close association with mafic
volcanics, leds to a suggestion that they correspond to a Large Igneous Province (LIP)
by Macambira and Ferreira Filho (2002). Due to poorly constrained age dating, this
suggestion was included in the LIP database (Ernst and Buchan, 2001; LIP
Commission database at www.largeigneousprovinces.org) as the 2.4 Ga Cateté Event,
an event remarked by the LIP Commission as poorly dated and possibly associated
with continental flood basalts.
This study provides the geological, petrological, geochemical and
geochronological characterization of the Serra da Onça and Serra do Puma layered
complexes. Results of this study, the first detailed characterization of mafic-
ultramafic intrusion in the western portion of the CMP, indicate a remarkably distinct
magmatic evolution for the Serra da Onça and Serra do Puma complexes. Our results
are compared with previous studies of layered intrusions developed in the eastern
portion of Carajás to improve the understanding of the mafic-ultramafic magmatism
and their mineral deposits in the CMP, as well as petrological processes associated
with fractionation of layered intrusions worldwide. Our results also provide additional
evidence for the significance of the 2.75 Ga mafic magmatic event in Carajás, thus
improving the database of LIP and mineral deposits through time.
2 Exploration and Development History
The Serra da Onça and Serra do Puma layered intrusions are best known for
hosting VALE's world-class nickel laterite deposit in Carajás. Nickel resources of the

10
Puma-Onça project, which includes open pit mine and Fe-Ni smelter, derive from
these two closely located layered intrusions. Before dealing with specific aspects of
these layered intrusions, it is worth revising the long exploration and development
history of this project.
The discovery in the late 60' of the giant iron deposits in the Serra dos Carajás,
located in the southeastern portion of Pará state, generated many exploratory
opportunities in this portion of the Amazonian Craton. Pioneers exploration
companies assembled mineral exploration research programs for Mn, Fe, Ni and Au.
In 1973, the company Inco Ltd., through its subsidiary in Brazil, started an extensive
mineral exploration in targets selected based on interpretation of aerial photographs
and radar image. With the confirmation that these targets consist of large mafic-
ultramafic complexes, where grades higher than 2% Ni were identified in laterites
developed over serpentinized dunite, the company developed an advanced project in
the Serra do Onça and the Serra do Puma complexes. This project allowed Inco to
establish in 1977 a total inferred resource, at a 1.5% Ni cutoff, of 30.8Mt @ 2.35% Ni
(Reported as part of the Feasibility Study of Canico Resource Corp. in 2005). In 2002,
Canico Resource Corp. settled an agreement with Inco for further development of
these resources. After a detailed drilling program and new resource evaluation, a
feasibility study was concluded in 2005, reporting estimated resources of 194.8Mt @
1.16% Ni (Feasibility Study of Canico Resource Corp). Currently the deposit is
operated by Vale S/A, which effected the acquisition in 2005. After additional
extensive detailed drilling and processing studies by Vale S/A, the first iron-nickel
mine in Carajás was developed. The total blocked resources (measured and indicated
resources) are 198.7 Mt @ 1.36% Ni (Vale 2013 Annual Report; in www.vale.com).
The Puma-Onça project produced 5,400 t of nickel contained in ferronickel in the first
quarter of 2014, reaching 86% of its nominal capacity for a single furnace operation
(Vale 1Q14 Report; in www.vale.com).
3 Regional Setting
3.1 The Carajás Mineral Province
The study area is located in the southwest portion of the Carajás Mineral
Province (CMP), one of the most important mineral districts in Brazil, with world-
class deposits of Fe, Mn, Cu, Au and Ni. The CMP is located in the southern part of
the Amazonian Craton, between the Araguaia Belt to the east and Paleoproterozoic

11
terrains of the Uatumã Supergroup to the west (Docegeo, 1988; Huhn et al., 1988)
(Fig. 1). This mineral province comprises two Archean tectonic blocks (Fig. 1), the
southern Rio Maria granitoid–greenstone terrain, represented by rocks of the
Andorinhas Supergroup (Huhn et al., 1988), and the northern Itacaiúnas Belt,
comprising the Itacaiúnas Supergroup of the Carajás Basin (Araújo et al., 1988). The
structural evolution of the CMP is attributed to the development of regional E-W
trending, steeply dipping fault zones, reactivated in several episodes in the Archean
and Paleoproterozoic (Holdsworth and Pinheiro, 2000). Paleoproterozoic (ca. 1.87-
1.88) extension events of the Amazonian Craton were indicated by dyke swarms in
the CMP (Rivalenti et al., 1998).
The southwest region of the CMP (Fig. 2), focus of this study, consists mainly
of gneiss, migmatite and granulite of the Xingu Complex (Docegeo, 1988). U-Pb
zircon ages (Machado et al., 1991) indicate that these rocks were formed in 2,859 2
Ma and migmatized in 2,851 4 Ma. Fragments of granite-greenstone terrains,
characterized by supracrustal rocks of the Tucumã Group (Araújo and Maia, 1991),
consist of metavolcanosedimentary sequences comprising mafic and felsic
metavolcanic rocks and interlayered metasediments (Macambira and Vale, 1997). U-
Pb zircon dating of a felsic metavolcanic rock of this sequence and of a
metagranodiorite indicate ages of 2,868 ± 8 Ma and 2,852 ± 16 Ma, respectively.
These data concur with the suggestion that the development of sialic crust in the south
portion of CMP occurred between 3.0-2.85 Ga (Avelar et al., 1999).
Several large felsic plutons, such as deformed Neoarchean (ca. 2.7 Ga)
alkaline granites of the Plaquê Suite (Araújo et al. 1994; Macambira et al., 1996) and
Paeloproterozoic granites (ca. 1.88 Ga; Gibbs et al., 1986; Machado et al., 1991;
Macambira and Lafon, 1995) intrude the Xingú Complex. The Neoarchean plutons
indicate a robust felsic magmatic event concomitant with the mafic volcanism of the
Itacaiúnas Supergroup rocks (Barros et al., 2001; Santos et al., 2001).
Mafic-ultramafic complexes consist of several elongated medium to large
intrusions following EW and NS regional trends (Macambira and Ferreira Filho,
2002). These mafic-ultramafic complexes are known to contain significant lateritic Ni
deposits, such as Onça, Puma, Jacaré, Jacarezinho and Mundial, developed over large
ultramafic zones where dunite predominates. Even though these intrusions were
originally interpreted as part of a magmatic suite (Cateté Suite; Macambira and Vale,

12
1997), different crystallization sequences were identified in these complexes
(Macambira and Ferreira Filho, 2002).

13
Figure 1 - A) Location of the Carajás Mineral Province. B) Geological map of Carajás Mineral Province (Modified from CPRM 2008). The area of the Serra da Onça and
Serra do Puma complexes (indicated in the map) is detailed in figures 2 and 3.

14
3.2 Layered intrusions
The Cateté Intrusive Suite (Macambira and Vale, 1997) corresponds to a set of
large to medium-size mafic-ultramafic intrusions located in the west portion of the
CMP (Fig. 1 and 2). This Suite intruded in Archean rocks of the Xingu Complex,
Plaquê Granite and São Félix Group (Fig. 2), considered by the authors as part of an
anorogenic extensional system. As reported by Macambira and Ferreira Filho (2002),
these layered intrusions have thick ultramafic zones at the base of the igneous
stratigraphy, where Ni laterite deposits developed over serpentinized dunite, and show
extensive fractionation toward mafic cumulates upward in the stratigraphy. Based on
different crystallization sequences, these layered intrusions were divided in two
distinct groups (Macambira and Ferreira Filho, 2002). One group, comprising the
Serra da Onça, Jacaré and Jacarezinho complexes, has abundant orthopyroxene as a
cumulus mineral and consists mainly of dunite, harzburgite, orthopyroxenite, norite
and gabbronorite. Another group, comprising the Serra do Puma and Carapanã, does
not crystallize orthopyroxene as a cumulus mineral and consists mainly of dunite,
wehrlite, clinopyroxenite and gabbro. The abundance of ultramafic rocks, as well as
the very primitive composition of cumulus olivine (Fo content up to 92 mol. %;
Ferreira Filho et al., 2007), indicates that a large amount of primitive mantle-derived
magmas intruded sialic crust in the southwestern portion of the CMP. Except for
disruptions along shear zones, these undeformed and unmetamorphosed layered
intrusions have nicely preserved igneous structure, fabric and mineralogy.
The age of these layered intrusions is poorly constrained in previous study.
Published geochronological results, restricted to the Serra da Onça Complex, consist
of one whole-rock Sm-Nd isochron (2,378±55 Ma; Macambira, 1997) and one
SHRIMP U-Pb zircon age for a gabbroic rock (2,766±6 Ma; unpublished data
reported by Lafon et al., 2000). The first age was used to suggest the ca. 2.4 Ga age
for the Cateté Suite (Macambira and Ferreira Filho, 2002; Ernst and Buchan, 2001),
but is inconsistent with new geological and geochronological results to be presented
and discussed in this paper. The Neoarchean age indicated by Lafon et al. (2000) is
consistent with the new data reported in this study, as well as recent data obtained for
layered intrusions in the eastern portion of the CMP (Teixeira, 2013; Teixeira et al.,
submitted). Age constraints for these layered intrusions will be further addressed in
the following discussions of this study.

15
The area of the Serra da Onça and Serra do Puma complexes were mapped by
VALE during exploration programs developed in 2006-2010 (Fig. 2). The eastern
portion of the Serra do Puma Complex (SPC) is located within a native people reserve
and was not mapped during VALE's exploration program. The location of the layered
complexes is controlled by major EW, NW-SE amd NE-SW regional trends of the
Itacaiúnas Shear Belt. These trends are associated with dip crustal discontinuities that
represent preferred sites of location of magma transferred from the mantle to the
crust. The Serra da Onça Complex (SOC) is located along the EW Canaã lineament,
whereas the Serra do Puma Complex (SPC) is located along the NE-SW McCandles
fault (Fig. 1). The SOC and SPC are intrusive into banded gneiss-migmatite of the
Xingú Complex or slightly foliated granitic intrusions of the Plaquê Suite (Fig. 2).

16
Figure 2 - Geological map of the area of the Serra da Onça and Serra do Puma complexes (partially
modified from Vale's unpublished internal reports).

17
Figure 3 - Analytical signal amplitude of the area indicated in Fig. 2 (partially modified from Vale's
unpublished internal reports). Dashed lines indicate mapped mafic-ultramafic intrusions.
4 Analytical Procedures
4.1 Microprobe analyses
Mineral analyses were performed on polished thin section using a 5-
spectrometer JEOL JXA-8230 SuperProbe at the Electron Microprobe Laboratory of
the University of Brasília (Brazil). The wavelength dispersive (WDS) analyses were
performed at an accelerating voltage of 15 kV and a beam current of 10 nA. Both
synthetic and natural mineral standards were used for the analyses and the same
standards and procedure were retained throughout the analytical work. Systematic
WDS analyses were obtained for olivine, pyroxene, and plagioclase. Representative
analyses of olivine, pyroxene and plagioclase are included in Appendix 01.

18
4.2 Bulk rock lithochemical analyses
Sample preparation and lithogeochemistry analyses were performed at ActLab
Laboratory using conventional major (XRF) and trace (ICP-MS) element routines. A
complete description of analytical methods is available in the ActLab Home Page
(www.actlabs.com). A total of 44 representative samples from outcrops were analysed
in the ActLab Laboratory. Results for these samples are shown in Table 01 (Serra da
Onça Complex) and Table 02 (Serra do Puma Complex).
4.3 Sm-Nd isotopic analyses
Sm-Nd isotopic analyses followed the method described by Gioia and
Pimentel (2000) and were carried out at the Geochronology Laboratory of the
University of Brasília (UnB). Whole-rock powders (~ 3000 mg) were mixed with
149Sm-
150Nd spike solution and dissolved in Savillex bombs. Sm and Nd extraction of
whole-rock samples followed conventional cation exchange techniques. The isotopic
measurements were carried out on a multi-collector Finnigan MAT 262 mass
spectrometer in static mode. The 143
Nd/144
Nd ratios were normalized to 146
Nd/144
Nd of
0.7219 and the decay constant used was 6.54 × 10⁻¹² a-1. The TDM values were
calculated using the model of DePaolo (1981). Nd procedure blanks were better than
100 pg. Sm-Nd results for 15 samples of the SOC and SPC are shown in Table 3.
4.4 LA-ICPMS U-Pb zircon analyses
Zircon concentrates were extracted from ca. 10-20 kg rock samples using
conventional gravimetric and magnetic techniques at the Geochronology Laboratory
of the University of Brasília. Mineral fractions were handpicked under a binocular
microscope to obtain fractions of similar size, shape and color. Before every micro-
analytical procedure, mounts were cleaned with dilute (2%) HNO3. Backscattered
electron and cathodoluminescence images were obtained using a FEI-QUANTA 450
SEM working at 15 kV at the University of Brasília. For U-Pb isotopic LA-ICPMS
analyses, the sample was mounted in an especially adapted laser cell and loaded into a
New Wave UP213 Nd:YAG laser (λ = 213 nm), linked to a Thermo Finnigan
Neptune Multi-collector ICPMS. The laser was run at a frequency of 10 Hz and
energy of ~100 mJ/cm2 with a spot diameter of 30μm for U-Pb systematics. The U-
Pb LA-ICPMS analyses followed the analytical procedure described by Buhn et al.
(2009) and were carried out at the Geochronology Laboratory of the University of

19
Brasília. Two international zircon standards were used. A fragment of zircon standard
GJ-1 (Jackson et al., 2004) was used as the primary reference material in a standard-
sample bracketing method, accounting for mass bias and drift correction (Albarède et
al., 2004). An internal standard was run at the start and at the end of each analytical
session, yielding accuracy around 2% and a precision in the range of 1% (1σ).
Uncertainties in sample analyses were propagated by quadratic addition of the
external uncertainty observed for the standards to the reproducibility and within-run
precision of each unknown analysis. Zircon grains with 206
Pb/204
Pb lower than 1000
were rejected. Plotting of U–Pb data was performed using ISOPLOT v.3 (Ludwig,
2001) and errors for isotopic ratios are presented at the 2σ level. U-Pb results for
sample SC68 are shown in Table 3.
5 Serra da Onça Layered Mafic-Ultramafic Complex
5.1 Geology and Petrography
The geology of the Serra da Onça Complex (SOC) was previously described
by Macambira (1997) and Macambira and Ferreira Filho (2002). Extensive mapping
and drilling, together with geochemical and geophysical surveys for mining or
brownfield exploration, provided new significant constraints on the geology and
stratigraphy of the layered sequence. The SOC consists of a 24 km-long and less than
3.5 km-wide EW trending intrusion (Fig. 3 and 4). Magmatic layering has consistent
moderate dip of 40-45° to the south (Fig. 4), as indicated by outcrops of layered
rocks, drill holes and geophysical modeling.

20
Figure 4 - Geological map and section of the Serra da Onça Complex.
The stratigraphy of the SOC consists of a Lower Border Group (LBG), an
Ultramafic Zone (UZ) and a Mafic Zone (MZ) (Fig. 4 and 6). The maximum
estimated thickness, considering the widest portion of the intrusion, is about 2.6 km.
Primary igneous minerals and textures are largely preserved in the SOC, except for
the serpentinization of olivine-rich rocks. Extensive replacement of igneous minerals
occurs along discrete shear zones and/or hydrothermal alteration, a feature that is not
considered in the following petrographic description.

21
The LBG forms a thin and discontinuous zone of abundant medium- to fine-
grained gabbronorite (Opx + Cpx + Pl cumulate) located at the northern limit of the
SOC (Fig. 5A). This zone is located at the base of the hill sustained by silica-rich
laterites developed over ultramafic rocks, such that boulders of laterites and
transported soil from ultramafic rocks partially cover the LBG. The stratigraphy of the
LBG is not constrained by geological traverses with abundant outcrops or layered in
situ outcrops. Scattered outcrops of harzburgite (Ol + Chr cumulate with large Opx
oikocrysts) and melanorite (Opx cumulate with intercumulus Pl) close to dunite of the
UZ are likely to correspond to an upward transition toward the UZ. This is similar to
what is described at the base of several layered intrusions (Eales et al., 1996;
McBirney, 1996; McCallum, 1996; Latypov, 2003). Considering that the LBG has the
same dip of the UZ and MZ, the maximum estimated thickness for this border zone is
about 125 meters (Fig. 4).
The UZ forms an elongated hill (Fig. 5A) and consists mainly of dunite (Ol +
Chr cumulate) and orthopyroxenite (Opx + Chr cumulate). Medium-grained dunite
with adcumulate texture predominates at the lower portion of the UZ (Fig. 5B and
5C), whereas medium- to coarse-grained adcumulate orthopyroxenite characterize the
upper portion (Fig. 3 and 4). Even though dunite is extensively to moderately
serpentinized, relicts of igneous olivine is eventually preserved in unweathered
outcrops. Orthopyroxenite is just lightly serpentinized and igneous Opx is largely
preserved in most outcrops (Fig. 5D). Two main layers of orthopyroxenite are
recognized. A lower thin one and an upper thick layer in the upper contact of the UZ
(Fig. 4). Chromite is a ubiquitous accessory mineral (0.5 to 3.0 vol. %) in dunite and
orthopyroxenite. The amount of chromite in orthopyroxenite decreases upward in the
stratigraphy and the uppermost orthopyroxenites do not have cumulus chromite.
Intercumulus minerals in dunite consist of large interstitial Opx and Cpx in dunite,
and Cpx and Pl in orthopyroxenite. The crystallization sequence of the UZ consists of
Ol+Chr; Ol+Opx+Chr; Opx+Chr and Opx.

22
Figure 5 - A) View from north to south of the Serra da Onça Complex. The hill correspond to the base
of the UZ. The LBG forms a narrow zone at the base of the hill. B) Weathered medium-grained
adcumulate dunite of the UZ. C) Photomicrograph of medium-grained dunite. The sample consists of
serpentinized olivine (Ol) and euhedral chromite (opaques). D) Photomicrograph of plagioclase
orthopyroxenite of the UZ. The sample consists of cumulus Opx and intercumulus plagioclase (Pl). E)
Photomicrograph of norite of the MZ. The sample is an Opx and plagioclase (Pl) cumulate with minor
intercumulus Cpx (anhedral crystals with higher birefringence). F) Gabbronorite of the MZ. The
sample is an adcumulate with cumulus Opx, Cpx and plagioclase (Pl).
The MZ consists mainly of medium-grained gabbronorite and covers about
half of the exposed area of the SOC (Fig. 4). Complete sections of the lower contact
of the MZ are exposed in three drill cores developed for exploration of Pt-Pd
anomalies in the central portion of the SOC (Ferreira Filho et al., 2007). This
transition zone consists of orthopyroxenite (Opx cumulate) of the UZ, followed by

23
sharp contacts to norite (Opx + Pl cumulate; Fig. 5E) and gabbronorite (Opx + Cpx +
Pl cumulate; Fig. 5F) upward in the stratigraphy. The MZ is wider and has abundant
outcrops in the western and central portion of the complex. In this portion Opx is
replaced by pigeonite (identified as inverted pigeonite) upward in the stratigraphy
(Pig + Cpx + Pl cumulate). The most fractionated rocks consist of layer of ilmenite-
magnetite-bearing gabbronorite (Pig + Cpx + Pl + Mag + Ilm cumulate) located in the
central portion of the MZ. This magnetite-ilmenite-bearing gabbronorite forms a thin
(< 50 meter-wide) stratigraphic marker, indicated by Ti and V anomalies in soil
geochemistry surveys. In these rocks accessory magnetite is a cumulus phase, while
ilmenite occur as a cumulus phase or as exsolution lamellae within cumulus magnetite
crystals. Primary layering, defined by different modal proportions of plagioclase and
pyroxene, and igneous lamination, defined by oriented plagioclase crystals, are
common features in the MZ.
A discontinuous layer and scattered outcrops of orthopyroxenite and
orthocumulate norite (cumulus Opx with intercumulus Pl) occur in the southern and
uppermost portion of the MZ. The upper contact of the MZ with foliated granites is
poorly constrained due to scattered outcrops. The reappearance of Opx cumulates in
the southern portion of the SOC, in contact with host granitic rocks, suggests that they
may represent an Upper Border Group of the layered intrusion.
Repeated sequences of cumulates within the MZ suggests the existence of
multiple injections of parental magma during the magmatic fractionation of the
magma chamber. The crystallization sequence of the MZ consists of Opx+Pl;
Opx+Pl+Cpx; Pig+Pl+Cpx and Pig+Pl+Cpx+Mag+Ilm. The complete sequence of
crystallization for the SOC is indicated by the following scheme:
olivine + chromite
olivine + orthopyroxene + chromite
orthopyroxene + chromite
orthopyroxene
orthopyroxene + plagioclase
orthopyroxene + clinopiroxene + plagioclase
pigeonite + clinopyroxene + plagioclase
pigeonite + clinopyroxene + plagioclase + magnetite + ilmenite
The contact between the UZ and the MZ is exposed in three drill cores drilled
during exploration for PGE in the SOC by CANICO (Ferreira Filho et al., 2007). In

24
the drill cores the contact between the UZ and MZ is sharp, characterized by Opx
adcumulate at the upper portion of the UZ followed by norite (Opx + Pl cumulate) at
the base of the MZ, separated by a thin (< 3 meter-thick) zone of orthopyroxenite with
interstitial plagioclase. These drill cores also show a sharp upward transition from an
about 50 meter-thick layer of norite (Opx+Pl cumulate) to gabbronorite
(Opx+Cpx+Pl).
The upper contact of the SOC is poorly exposed. The occurrence of an
orthopyroxenite layer in the western portion of the intrusion (Fig. 4), as well as
scattered outcrops of relatively more primitive rocks (norite, harzburgite) close to the
upper contact with host granite, suggest that they belong to an upper border group
(i.e., UBG in Fig. 6).
Figure 6 - Stratigraphy of the Serra da Onça Complex.

25
5.2 Mineral Chemistry
Systematic analyses of olivine, orthopyroxene and plagioclase crystals were
performed in unweathered samples through a complete section of the SOC (see Fig. 4
for location of samples). Due to extensive weathering and/or serpentinization,
analyses of olivine in the UZ are limited to a few samples. Representative microprobe
analyses for minerals of the SOC are provided in Appendix 1.
The composition of olivine crystals in dunite and olivine orthopyroxenite
samples from the UZ ranges from Fo92.4 to Fo86.2, indicating very primitive (i.e., very
high Fo content) to primitive compositions. The small number of samples does not
provide a systematic cryptic variation of olivine in the UZ. The results however
suggest the existence of significant reversals, as indicated by very primitive
composition of olivine (Fo92) in the upper portion of the UZ (Fig. 7). Ni contents in
olivine range from 3,280-4,190 ppm in dunite and 2,150-2,600 ppm in olivine
orthopyroxenite (Fig. 8). Ni contents in olivine are not positively correlated as
indicated by highly variable Ni contents for olivine with similar Fo content (~ Fo92).
This may indicate depletion of Ni associated with sulfide segregation during the
magmatic evolution of the SOC or new influxes of Ni depleted magma.
Figure 7 - Compositional variation of olivine, orthopyroxene and plagioclase throughout the
stratigraphy of the SOC.

26
Figure 8 - Plot of Fo versus Ni content of olivine of the SOC. The dashed line is the compositional
trend for olivine from layered complexes (Simkin and Smith, 1970).
Opx compositions in few samples of orthopyroxenite of the UZ are very
primitive and range from En89.8 to En88.7. These compositions the UZ contrast with
more fractionated compositions of Opx in gabbroic rocks of the MZ (Fig. 07).
Systematic analyses of Opx in gabbroic rocks provide cryptic variation data for the
MZ (Fig. 7). Opx compositions in the MZ range from En75.9 to En54.3, following a
trend characterized by several reversals (Fig. 7). Opx compositions in the lower
portion of the MZ follow a continuous fractionation trend, a feature consistent with
the continuous crystallization sequence (from Opx cumulate, to Opx+Pl cumulate and
Opx+Cpx+Pl cumulate) investigated in drill cores where the contact of the UZ to the
MZ is exposed. Successive reversals in the fractionation of Opx in the MZ are likely
to result from new influxes of primitive magma in a dynamic magma chamber.
Plagioclase compositions in the MZ range from An63.7 to An47.4 and follow the
same pattern of cryptic variation indicated by Opx compositions (Fig. 7). Similar
cryptic variation pattern for Opx and Pl in the MZ of the SOC is consistent with their
crystallization as cumulus minerals throughout the MZ.

27
6 Serra do Puma Layered Mafic-Ultramafic Complex
6.1 Geology and Petrography
The Serra do Puma Complex (SPC) consists of a 25 km-long and less than 3
km-wide SW-NE trending layered intrusion (Fig. 1). The eastern half of the complex
is located within a native people (Xikrin Group) reserve where exploration activities
and mapping are not allowed. Extensive mapping and drilling, together with
geochemical and geophysical surveys for mining or brownfield exploration, provided
a detailed map for the western half of the SPC (Fig. 9). Magmatic layering has
consistent moderate dip of 30-40° to the southeast (Fig. 9), as indicated by outcrops of
layered rocks and geophysical modeling.
The SPC consists of a Lower Border Group (LBG), an Ultramafic Zone (UZ)
and a Layered Zone (LZ) (Fig. 9 and 11). The maximum estimated thickness of the
eastern portion of the SPC, considering the widest portion of the intrusion, is about
2.1 km (Fig. 9 and 11). Primary igneous minerals and textures are largely preserved in
the SPC, except for the serpentinization of olivine-rich rocks. Extensive replacement
of igneous minerals occurs along discrete shear zones and/or hydrothermal alteration,
a feature that is not considered in the following petrographic description.

28
Figure 9 - Geological map and section of the Serra do Puma Complex.
The LBG forms a thin but distinct zone of gabbroic rocks located in the
northern border of the SPC (Fig. 9). Similar to the SOC, this border group is located
at the base of the hill sustained by silica-rich laterites, such that outcrops are scarce in
this partially covered area. The LBG consists mainly of fine- to medium-grained
gabbro (Cpx + Pl cumulate), has an estimated thickness of 110 meters and is located
at the base of the layered intrusion.
The UZ forms an elongated hill (Fig. 10A) and consists mainly of dunite with
minor interlayered peridotite and clinopyroxenite. The UZ has an estimated thickness

29
of up to 950 meters in the area mapped in detail of the SPC (Fig. 9 and 11). Dunite
occurs as medium-grained adcumulate rocks with cumulus olivine and chromite.
Dunite is extensively serpentinized and/or weathered and primary olivine is rarely
preserved in the UZ. Chromite, a ubiquitous accessory mineral (0.5 to 3.0 vol. %) in
dunite of the UZ, occurs as fine-grained euhedral crystals, generally located between
larger olivine crystals. Intercumulus minerals in dunite consist of Opx and Cpx that
form large (up to few centimeters) oikocrysts enclosing several olivine crystals.
Layers of peridotite consist of Ol + Chr cumulates with abundant interstitial Cpx and
minor Opx (usually wehrlite or lherzolite), or Ol + Cpx cumulate with minor
intercumulus Opx and Pl (usually wehrlite). The latter, together with clinopyroxenite
(Cpx cumulate), form thin (up to 100 meter-thick) and discontinuous layers in the UZ.
The amount of interlayered peridotites and clinopyroxenite increases toward the upper
portion of the UZ.
The Layered Zone (LZ) consists mainly of gabbro (Cpx + Pl cumulate) with
abundant interlayered peridotite and minor clinopyroxenite. The LZ has an estimated
thickness of up to 1,050 meters in the area mapped in detail of the SPC (Fig. 9 and
11). Gabbro occurs as medium-grained adcumulates, consisting of cumulus Pl and
Cpx (Fig. 10F). Modal layering, consisting of variable proportions of Cpx and Pl
(from gabbro to leucogabbro), is frequent in large outcrops of gabbroic rocks of the
LZ (Fig. 10B). These rhythmic layers vary from few centimeters up to few meters
thick. Igneous lamination, defined by oriented tabular plagioclase crystals (Fig. 10F),
is also frequent in outcrops of gabbroic rocks of the LZ. Few pockets of pegmatoidal
magnetite-gabbro occur within medium-grained gabbro of the LZ. These pockets (up
to 1-2 meters) are interpreted as portions enriched in fractionated residual trapped
liquid within the LZ. Clinopyroxenite consists of medium- to coarse-grained Cpx
cumulate with variable proportions of interstitial (intercumulus) plagioclase (Fig.
10E). Depending on the amount of interstitial plagioclase the texture varies from
adcumulate to mesocumulate. Clinopyroxenite layers are up to 100 meters thick and
include transitional compositions to wehrlite (i.e. olivine clinopyroxenite; Fig. 10D)
or gabbro (i.e. melagabbro). Peridotites have variable modal compositions and occur
interlayered with gabbro throughout the LZ. Individual layers of peridotite are up to
150 meters thick, but thinner layers (usually 10-50 meters thick) predominate.
Xenoliths of gabbro are frequent in peridotite layers. These xenoliths occur as
irregular or elongated whitish blocks enclosed in dark colored peridotite (Fig. 10C).

30
Xenoliths of gabbro have irregular or rounded borders indicating that they are
partially melted and reabsorbed by the ultramafic rock. Peridotites are medium- to
coarse-grained Ol + Chr cumulates (or Ol + Cpx + Chr cumulates) with variable
proportions of interstitial minerals (Cpx, Opx and Pl). The texture varies from
mesocumulate to orthocumulate depending on the amount of interstitial minerals.
Peridotites are usually wehrlite (Ol+Chr cumulate with abundant intercumulus Cpx,
or an Ol+Cpx+Chr cumulate), but lherzolite (Ol + Chr cumulate with abundant
intercumulus Cpx and Opx), plagioclase wehrlite or plagioclase lherzolite (with Pl as
an additional intercumulus mineral) are frequent rock types. Peridotites frequently
have both Cpx and Opx, but the modal amounts of Cpx are systematically much
greater than Opx. Chromite is a ubiquitous accessory mineral (0.5 to 3.0 vol. %) in
peridotites of the LZ and occurs as fine-grained euhedral crystals, generally enclosed
in Cpx, Opx or Pl oikocrysts. Cotetic crystallization of olivine and chromite,
indicating an Ol + Chr cumulate, occurs in dunite of the UZ and most peridotites of
the UZ and LZ, but chromite usually disappear in Cpx + Ol cumulates.
The upper contact of the SPC to the southeast is poorly exposed. The contact
zone is characterized by boulders of gabbro and associated peridotite of the SPC to
the north, interpreted as a zone of interlayered gabbro and peridotite, and a quartz-rich
soil with scattered boulders of gneiss of the host rock to the south.

31
Figure 10 - A) View from south to north of the Serra do Puma Complex. The hill correspond to the
UZ. The boulders in the front view consist of gabbro from the upper portion of the LZ. B) Layered
gabbro of the LZ. C) Elongated xenolith of gabbro within peridotite of the LZ. D) Photomicrograph of
olivine clinopyroxenite with adcumulate textute of the LZ. The sample consists of cumulus Cpx and
olivine (Ol) . E) Photomicrograph of clinopyroxenite of the UZ. The sample is an Cpx cumulate with
minor intercumulus plagioclase (Pl). F) Gabbro of the LZ with igneous lamination. The sample is an
adcumulate with cumulus Cpx and plagioclase (Pl).

32
Figure 11 - Stratigraphy of the Serra do Puma Complex.
Frequent interlayer of gabbro and peridotite in the LZ suggests the existence
of multiple injections of parental magma during the magmatic fractionation of the
magma chamber. Partially reabsorbed xenoliths of gabbro within peridotite layers
indicate magmatic erosion of previously crystallized layers of gabbro by new
injections of parental magma. This indicates that the LZ developed in a dynamic
magma chamber with successive influxes of parental magma. The crystallization
sequence of the SPC consists of Ol+Chr, Ol+Cpx+Chr, Ol+Cpx, Cpx and Cpx+Pl,
The complete sequence of crystallization for the SPC is indicated by the following
scheme:
olivine + chromite
olivine + clinopyroxene + chromite
olivine + clinopyroxene
clinopyroxene
clinopyroxene + plagioclase

33
6.2 Mineral Chemistry
Systematic analyses of olivine, clinopyroxene and plagioclase were performed
in unweathered samples through a complete section of the SPC (see Fig. 9 for the
location of samples). Representative microprobe analyses for minerals of the SPC are
provided in Appendix 1.
Due to extensive weathering and/or serpentinization analyses of olivine
crystals are limited to just one sample of dunite from the UZ (Fig. 12). Olivine
composition of this sample is primitive (Fo88.6 to Fo87.7) and enriched in nickel (2,840
to 3,210 ppm). This sample is located in the upper half portion of the UZ and,
therefore, should not be considered as the most primitive olivine of the SPC.
Systematic analyses of olivine crystals in peridotites (11 samples) and olivine-bearing
clinopyroxenite (01 sample) from the upper portion of the UZ and throughout the LZ
provide cryptic variation data for this stratigraphic interval of the SPC (Fig. 12).
Olivine compositions in this interval are moderately primitive and range from Fo85.0 to
Fo76.2, with higher contents of Fo in one sample located in the upper portion of the UZ
and another in the upper portion of the MZ (Fig. 12). These results indicate several
reversals and do not provide evidence for progressive fractionation of olivine
throughout the MZ. The compositional variation of olivine in the LZ is likely to result
from successive new influxes of parental magma, thus reinforcing the geological
evidences for a dynamic magma chamber. Nickel contents in olivine crystals from
peridotites and olivine-bearing clinopyroxenite range from 1,525 to 3,525 ppm.
Nickel contents in olivine of samples from the SPC (including one dunite) are
positively correlated with Fo contents (Fig. 13). These results are consistent with
compositions of nickel-undepleted olivine for layered intrusions (Fig. 13).
Clinopyroxene and plagioclase compositions of samples from the upper
portion of the UZ and throughout the LZ are indicated in Figure 12. In general these
results follow the same pattern of cryptic variation indicated by olivine compositions
(Fig. 12). Compared with the compositions of olivine, results for plagioclase and Cpx
have larger range of compositions for specific samples. These highly variable
compositions occur in samples where these minerals are interstitial (intercumulus).

34
Figure 12 - Compositional variation of olivine, clinopyroxene and plagioclase throughout the
stratigraphy of the SPC.
Figure 13 - Plot of Fo versus Ni content of olivine of the SPC. The dashed line is the compositional
trend for olivine from layered complexes (Simkin and Smith, 1970).

35
7 Bulk Rock Geochemistry
7.1 Major and Minor Elements
Whole-rock chemical compositions of the Serra da Onça and Serra do Puma
complexes samples are listed in Table 1 and 2, respectively. Because these layered
complexes consist of cumulate rocks, their major and minor element compositions are
dominantly controlled by the type of cumulus minerals. The plot of selected major
and minor elements against Mg# (i.e. MgO/[MgO+FeOt]) indicates the predominance
of olivine, pyroxene and plagioclase cumulates (Fig. 14).
The large variation of Mg# is consistent with petrographic and mineral
chemistry data for cumulate rocks of both complexes. Samples of dunite and
peridotite of the SOC have higher Mg# (79.8 to 86.8 %) compared with those of the
SPC (62.6 to 79.4 %). Higher Mg# for samples of the SOC may reflect the lack of
analyses of ultramafic samples from the lower portion of the UZ of the SPC. On the
other hand, the extensive fractionation of ultramafic rocks of the SPC result from
interlayered peridotites throughout the upper portions of the stratigraphy, a feature
that does not occur at the SOC. High contents of Ni and Cr in samples of ultramafic
rocks of both complexes are controlled by olivine and accessory chromite,
respectively (Fig. 14). High Cr contents (up to > 1 wt. %) are consistent with the
occurrence of cumulus chromite in dunite and peridotites in samples from these
complexes. Samples of gabbroic rocks of the SPC have higher Mg# (45.6 to 78.1 %)
compared with those of the SOC (28.1 to 65.3 %), which reflect the sharp transition
from the lower UZ to the upper MZ in the SOC, as well as the extensive fractionation
of the gabbroic rocks. The latter is well indicated by cryptic variation data for the
SOC (Fig. 7). Distinct contents of TiO2 for samples of the SOC and SPC reflect the
abundance of Cpx as a cumulus mineral in the latter (Fig. 14). The difference in the
crystallization sequence is nicely illustrated by the MgO-CaO plot for pyroxenites and
gabbroic rocks, as indicated by distinct trends for samples of the SOC and SPC (Fig.
15).
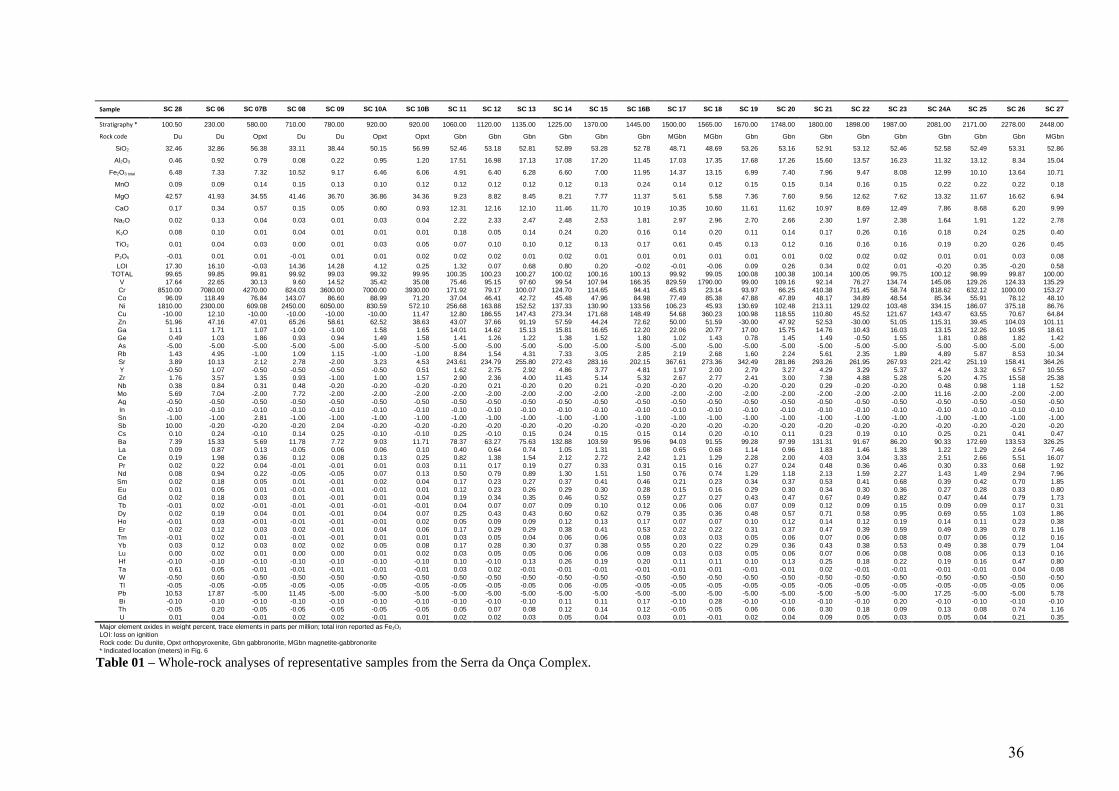
36
Sample SC 28 SC 06 SC 07B SC 08 SC 09 SC 10A SC 10B SC 11 SC 12 SC 13 SC 14 SC 15 SC 16B SC 17 SC 18 SC 19 SC 20 SC 21 SC 22 SC 23 SC 24A SC 25 SC 26 SC 27
Stratigraphy * 100.50 230.00 580.00 710.00 780.00 920.00 920.00 1060.00 1120.00 1135.00 1225.00 1370.00 1445.00 1500.00 1565.00 1670.00 1748.00 1800.00 1898.00 1987.00 2081.00 2171.00 2278.00 2448.00
Rock code Du Du Opxt Du Du Opxt Opxt Gbn Gbn Gbn Gbn Gbn Gbn MGbn MGbn Gbn Gbn Gbn Gbn Gbn Gbn Gbn Gbn MGbn
SiO2 32.46 32.86 56.38 33.11 38.44 50.15 56.99 52.46 53.18 52.81 52.89 53.28 52.78 48.71 48.69 53.26 53.16 52.91 53.12 52.46 52.58 52.49 53.31 52.86
Al2O3 0.46 0.92 0.79 0.08 0.22 0.95 1.20 17.51 16.98 17.13 17.08 17.20 11.45 17.03 17.35 17.68 17.26 15.60 13.57 16.23 11.32 13.12 8.34 15.04
Fe2O3 total 6.48 7.33 7.32 10.52 9.17 6.46 6.06 4.91 6.40 6.28 6.60 7.00 11.95 14.37 13.15 6.99 7.40 7.96 9.47 8.08 12.99 10.10 13.64 10.71
MnO 0.09 0.09 0.14 0.15 0.13 0.10 0.12 0.12 0.12 0.12 0.12 0.13 0.24 0.14 0.12 0.15 0.15 0.14 0.16 0.15 0.22 0.22 0.22 0.18
MgO 42.57 41.93 34.55 41.46 36.70 36.86 34.36 9.23 8.82 8.45 8.21 7.77 11.37 5.61 5.58 7.36 7.60 9.56 12.62 7.62 13.32 11.67 16.62 6.94
CaO 0.17 0.34 0.57 0.15 0.05 0.60 0.93 12.31 12.16 12.10 11.46 11.70 10.19 10.35 10.60 11.61 11.62 10.97 8.69 12.49 7.86 8.68 6.20 9.99
Na2O 0.02 0.13 0.04 0.03 0.01 0.03 0.04 2.22 2.33 2.47 2.48 2.53 1.81 2.97 2.96 2.70 2.66 2.30 1.97 2.38 1.64 1.91 1.22 2.78
K2O 0.08 0.10 0.01 0.04 0.01 0.01 0.01 0.18 0.05 0.14 0.24 0.20 0.16 0.14 0.20 0.11 0.14 0.17 0.26 0.16 0.18 0.24 0.25 0.40
TiO2 0.01 0.04 0.03 0.00 0.01 0.03 0.05 0.07 0.10 0.10 0.12 0.13 0.17 0.61 0.45 0.13 0.12 0.16 0.16 0.16 0.19 0.20 0.26 0.45
P2O5 -0.01 0.01 0.01 -0.01 0.01 0.01 0.02 0.02 0.02 0.01 0.02 0.01 0.01 0.01 0.01 0.01 0.01 0.02 0.02 0.02 0.01 0.01 0.03 0.08
LOI 17.30 16.10 -0.03 14.36 14.28 4.12 0.25 1.32 0.07 0.68 0.80 0.20 -0.02 -0.01 -0.06 0.09 0.26 0.34 0.02 0.01 -0.20 0.35 -0.20 0.58
TOTAL 99.65 99.85 99.81 99.92 99.03 99.32 99.95 100.35 100.23 100.27 100.02 100.16 100.13 99.92 99.05 100.08 100.38 100.14 100.05 99.75 100.12 98.99 99.87 100.00
V 17.64 22.65 30.13 9.60 14.52 35.42 35.08 75.46 95.15 97.60 99.54 107.94 166.35 829.59 1790.00 99.00 109.16 92.14 76.27 134.74 145.06 129.26 124.33 135.29
Cr 8510.00 7080.00 4270.00 824.03 3600.00 7000.00 3930.00 171.92 79.17 100.07 124.70 114.65 94.41 45.63 23.14 93.97 66.25 410.38 711.45 58.74 818.62 632.12 1000.00 153.27
Co 96.09 118.49 76.84 143.07 86.60 88.99 71.20 37.04 46.41 42.72 45.48 47.96 84.98 77.49 85.38 47.88 47.89 48.17 34.89 48.54 85.34 55.91 78.12 48.10
Ni 1810.00 2300.00 609.08 2450.00 6050.00 830.59 572.10 256.68 163.88 152.52 137.33 130.90 133.56 106.23 45.93 130.69 102.48 213.11 129.02 103.48 334.15 186.07 375.18 86.76
Cu -10.00 12.10 -10.00 -10.00 -10.00 -10.00 11.47 12.80 186.55 147.43 273.34 171.68 148.49 54.68 360.23 100.98 118.55 110.80 45.52 121.67 143.47 63.55 70.67 64.84
Zn 51.96 47.16 47.01 65.26 58.61 62.52 38.63 43.07 37.66 91.19 57.59 44.24 72.62 50.00 51.59 -30.00 47.92 52.53 -30.00 51.05 115.31 39.45 104.03 101.11
Ga 1.11 1.71 1.07 -1.00 -1.00 1.58 1.65 14.01 14.62 15.13 15.81 16.65 12.20 22.06 20.77 17.00 15.75 14.76 10.43 16.03 13.15 12.26 10.95 18.61
Ge 0.49 1.03 1.86 0.93 0.94 1.49 1.58 1.41 1.26 1.22 1.38 1.52 1.80 1.02 1.43 0.78 1.45 1.49 -0.50 1.55 1.81 0.88 1.82 1.42
As -5.00 -5.00 -5.00 -5.00 -5.00 -5.00 -5.00 -5.00 -5.00 -5.00 -5.00 -5.00 -5.00 -5.00 -5.00 -5.00 -5.00 -5.00 -5.00 -5.00 -5.00 -5.00 -5.00 -5.00
Rb 1.43 4.95 -1.00 1.09 1.15 -1.00 -1.00 8.84 1.54 4.31 7.33 3.05 2.85 2.19 2.68 1.60 2.24 5.61 2.35 1.89 4.89 5.87 8.53 10.34
Sr 3.89 10.13 2.12 2.78 -2.00 3.23 4.53 243.61 234.79 255.80 272.43 283.16 202.15 367.61 273.36 342.49 281.86 293.26 261.95 267.93 221.42 251.19 158.41 364.26
Y -0.50 1.07 -0.50 -0.50 -0.50 -0.50 0.51 1.62 2.75 2.92 4.86 3.77 4.81 1.97 2.00 2.79 3.27 4.29 3.29 5.37 4.24 3.32 6.57 10.55
Zr 1.76 3.57 1.35 0.93 -1.00 1.00 1.57 2.90 2.36 4.00 11.43 5.14 5.32 2.67 2.77 2.41 3.00 7.38 4.88 5.28 5.20 4.75 15.58 25.38
Nb 0.38 0.84 0.31 0.48 -0.20 -0.20 -0.20 -0.20 0.21 -0.20 0.20 0.21 -0.20 -0.20 -0.20 -0.20 -0.20 0.29 -0.20 -0.20 0.48 0.98 1.18 1.52
Mo 5.69 7.04 -2.00 7.72 -2.00 -2.00 -2.00 -2.00 -2.00 -2.00 -2.00 -2.00 -2.00 -2.00 -2.00 -2.00 -2.00 -2.00 -2.00 -2.00 11.16 -2.00 -2.00 -2.00
Ag -0.50 -0.50 -0.50 -0.50 -0.50 -0.50 -0.50 -0.50 -0.50 -0.50 -0.50 -0.50 -0.50 -0.50 -0.50 -0.50 -0.50 -0.50 -0.50 -0.50 -0.50 -0.50 -0.50 -0.50
In -0.10 -0.10 -0.10 -0.10 -0.10 -0.10 -0.10 -0.10 -0.10 -0.10 -0.10 -0.10 -0.10 -0.10 -0.10 -0.10 -0.10 -0.10 -0.10 -0.10 -0.10 -0.10 -0.10 -0.10
Sn -1.00 -1.00 2.81 -1.00 -1.00 -1.00 -1.00 -1.00 -1.00 -1.00 -1.00 -1.00 -1.00 -1.00 -1.00 -1.00 -1.00 -1.00 -1.00 -1.00 -1.00 -1.00 -1.00 -1.00
Sb 10.00 -0.20 -0.20 -0.20 2.04 -0.20 -0.20 -0.20 -0.20 -0.20 -0.20 -0.20 -0.20 -0.20 -0.20 -0.20 -0.20 -0.20 -0.20 -0.20 -0.20 -0.20 -0.20 -0.20
Cs 0.10 0.24 -0.10 0.14 0.25 -0.10 -0.10 0.25 -0.10 0.15 0.24 0.15 0.15 0.14 0.20 -0.10 0.11 0.23 0.19 0.10 0.25 0.21 0.41 0.47
Ba 7.39 15.33 5.69 11.78 7.72 9.03 11.71 78.37 63.27 75.63 132.88 103.59 95.96 94.03 91.55 99.28 97.99 131.31 91.67 86.20 90.33 172.69 133.53 326.25
La 0.09 0.87 0.13 -0.05 0.06 0.06 0.10 0.40 0.64 0.74 1.05 1.31 1.08 0.65 0.68 1.14 0.96 1.83 1.46 1.38 1.22 1.29 2.64 7.46
Ce 0.19 1.98 0.36 0.12 0.08 0.13 0.25 0.82 1.38 1.54 2.12 2.72 2.42 1.21 1.29 2.28 2.00 4.03 3.04 3.33 2.51 2.66 5.51 16.07
Pr 0.02 0.22 0.04 -0.01 -0.01 0.01 0.03 0.11 0.17 0.19 0.27 0.33 0.31 0.15 0.16 0.27 0.24 0.48 0.36 0.46 0.30 0.33 0.68 1.92
Nd 0.08 0.94 0.22 -0.05 -0.05 0.07 0.13 0.50 0.79 0.89 1.30 1.51 1.50 0.76 0.74 1.29 1.18 2.13 1.59 2.27 1.43 1.49 2.94 7.96
Sm 0.02 0.18 0.05 0.01 -0.01 0.02 0.04 0.17 0.23 0.27 0.37 0.41 0.46 0.21 0.23 0.34 0.37 0.53 0.41 0.68 0.39 0.42 0.70 1.85
Eu 0.01 0.05 0.01 -0.01 -0.01 -0.01 0.01 0.12 0.23 0.26 0.29 0.30 0.28 0.15 0.16 0.29 0.30 0.34 0.30 0.36 0.27 0.28 0.33 0.80
Gd 0.02 0.18 0.03 0.01 -0.01 0.01 0.04 0.19 0.34 0.35 0.46 0.52 0.59 0.27 0.27 0.43 0.47 0.67 0.49 0.82 0.47 0.44 0.79 1.73
Tb -0.01 0.02 -0.01 -0.01 -0.01 -0.01 -0.01 0.04 0.07 0.07 0.09 0.10 0.12 0.06 0.06 0.07 0.09 0.12 0.09 0.15 0.09 0.09 0.17 0.31
Dy 0.02 0.19 0.04 0.01 -0.01 0.04 0.07 0.25 0.43 0.43 0.60 0.62 0.79 0.35 0.36 0.48 0.57 0.71 0.58 0.95 0.69 0.55 1.03 1.86
Ho -0.01 0.03 -0.01 -0.01 -0.01 -0.01 0.02 0.05 0.09 0.09 0.12 0.13 0.17 0.07 0.07 0.10 0.12 0.14 0.12 0.19 0.14 0.11 0.23 0.38
Er 0.02 0.12 0.03 0.02 -0.01 0.04 0.06 0.17 0.29 0.29 0.38 0.41 0.53 0.22 0.22 0.31 0.37 0.47 0.39 0.59 0.49 0.39 0.78 1.16
Tm -0.01 0.02 0.01 -0.01 -0.01 0.01 0.01 0.03 0.05 0.04 0.06 0.06 0.08 0.03 0.03 0.05 0.06 0.07 0.06 0.08 0.07 0.06 0.12 0.16
Yb 0.03 0.12 0.03 0.02 0.02 0.05 0.08 0.17 0.28 0.30 0.37 0.38 0.55 0.20 0.22 0.29 0.36 0.43 0.38 0.53 0.49 0.38 0.79 1.04
Lu 0.00 0.02 0.01 0.00 0.00 0.01 0.02 0.03 0.05 0.05 0.06 0.06 0.09 0.03 0.03 0.05 0.06 0.07 0.06 0.08 0.08 0.06 0.13 0.16
Hf -0.10 -0.10 -0.10 -0.10 -0.10 -0.10 -0.10 0.10 -0.10 0.13 0.26 0.19 0.20 0.11 0.11 0.10 0.13 0.25 0.18 0.22 0.19 0.16 0.47 0.80
Ta 0.61 0.05 -0.01 -0.01 -0.01 -0.01 -0.01 0.03 0.02 -0.01 -0.01 -0.01 -0.01 -0.01 -0.01 -0.01 -0.01 0.02 -0.01 -0.01 -0.01 -0.01 0.04 0.08
W -0.50 0.60 -0.50 -0.50 -0.50 -0.50 -0.50 -0.50 -0.50 -0.50 -0.50 -0.50 -0.50 -0.50 -0.50 -0.50 -0.50 -0.50 -0.50 -0.50 -0.50 -0.50 -0.50 -0.50
Tl -0.05 -0.05 -0.05 -0.05 -0.05 -0.05 -0.05 -0.05 -0.05 -0.05 0.06 -0.05 -0.05 -0.05 -0.05 -0.05 -0.05 -0.05 -0.05 -0.05 -0.05 -0.05 -0.05 0.06
Pb 10.53 17.87 -5.00 11.45 -5.00 -5.00 -5.00 -5.00 -5.00 -5.00 -5.00 -5.00 -5.00 -5.00 -5.00 -5.00 -5.00 -5.00 -5.00 -5.00 17.25 -5.00 -5.00 5.78
Bi -0.10 -0.10 -0.10 -0.10 -0.10 -0.10 -0.10 -0.10 -0.10 -0.10 0.11 0.11 0.17 -0.10 0.28 -0.10 -0.10 -0.10 -0.10 0.20 -0.10 -0.10 -0.10 -0.10
Th -0.05 0.20 -0.05 -0.05 -0.05 -0.05 -0.05 0.05 0.07 0.08 0.12 0.14 0.12 -0.05 -0.05 0.06 0.06 0.30 0.18 0.09 0.13 0.08 0.74 1.16
U 0.01 0.04 -0.01 0.02 0.02 -0.01 0.01 0.02 0.02 0.03 0.05 0.04 0.03 0.01 -0.01 0.02 0.04 0.09 0.05 0.03 0.05 0.04 0.21 0.35
Major element oxides in weight percent, trace elements in parts per million; total iron reported as Fe2O3
LOI: loss on ignition
Rock code: Du dunite, Opxt orthopyroxenite, Gbn gabbronorite, MGbn magnetite-gabbronorite
* Indicated location (meters) in Fig. 6
Table 01 – Whole-rock analyses of representative samples from the Serra da Onça Complex.

37
Sample SC 33A SC 33B SC 34A SC 34B SC 35 SC 36 SC 37 SC 38 SC 39 SC 40A SC 41 SC 43 SC 44 SC 45 SC 46 SC 47A SC 47B SC 48 SC 50 SC 51
Stratigraphy * 2391.00 2391.00 2254.00 2254.00 2210.00 2130.00 2073.00 2029.00 1998.00 1930.00 1850.00 1585.00 1526.00 1473.00 1213.00 1184.00 1184.00 1145.00 790.00 661.00
Rock code Gb Per Gb Pl-Per Gb Per Per Pl-Per Pl-Per Pl-Per Pl-Per Gb Gb Gb Cpxt Cpxt Gb Per Du Du
SiO2 50.87 41.14 52.28 42.44 53.11 40.37 41.49 40.41 39.46 37.36 40.29 51.85 51.73 52.28 52.56 53.30 52.43 41.83 37.62 37.53
Al2O3 15.91 4.23 13.37 4.37 15.52 7.33 7.67 7.69 6.78 2.70 7.15 8.60 16.14 10.34 3.62 6.51 11.66 2.22 0.85 0.38
Fe2O3 total 5.51 12.36 10.14 14.88 7.11 13.47 14.44 13.67 14.10 15.88 13.12 5.94 3.70 4.85 6.15 4.42 3.50 10.89 10.19 10.78
MnO 0.11 0.17 0.14 0.23 0.11 0.21 0.23 0.21 0.22 0.21 0.21 0.12 0.08 0.10 0.13 0.11 0.08 0.16 0.15 0.13
MgO 9.11 31.74 8.50 24.94 7.11 25.48 25.87 26.04 25.96 31.93 26.56 13.88 9.33 12.63 17.43 15.50 12.45 33.10 39.21 34.93
CaO 12.10 4.40 10.96 6.82 11.11 5.16 5.00 4.94 4.90 2.19 5.73 15.87 15.31 16.53 18.06 18.93 16.84 6.44 0.61 0.16
Na2O 2.40 0.50 2.76 0.44 3.41 0.77 0.85 0.61 0.48 0.14 0.58 1.40 2.32 1.57 0.73 0.88 1.59 0.21 0.06 0.04
K2O 1.16 0.22 0.42 0.12 0.34 0.44 0.22 0.23 0.30 0.10 0.28 0.27 0.21 0.46 0.04 0.11 0.32 0.06 0.06 0.04
TiO2 0.24 0.22 0.54 0.28 0.44 0.19 0.18 0.15 0.13 0.17 0.16 0.24 0.13 0.19 0.30 0.15 0.13 0.09 0.04 0.02
P2O5 0.03 0.03 0.03 0.02 0.05 0.02 0.02 0.02 0.01 0.01 0.02 0.02 0.01 0.01 0.02 0.01 0.02 0.01 0.01 0.01
LOI 2.60 4.77 1.23 5.09 1.49 5.54 4.37 5.93 7.19 8.89 5.41 1.79 1.45 1.24 0.80 0.42 1.27 4.84 11.07 14.98
TOTAL 100.03 99.77 100.36 99.63 99.81 98.98 100.35 99.91 99.52 99.57 99.52 99.97 100.41 100.21 99.84 100.33 100.27 99.86 99.87 99.00
V 118.10 85.68 255.43 138.01 158.35 70.78 66.03 54.14 63.82 87.61 63.52 180.52 106.23 161.34 204.52 156.91 117.59 70.02 32.84 35.14
Cr 251.27 2530.00 304.69 2720.00 256.24 1560.00 1200.00 1190.00 1450.00 2930.00 1440.00 439.20 215.62 818.80 2320.00 1320.00 680.61 2970.00 4520.00 >10,000
Co 30.75 114.12 43.57 121.13 32.68 51.64 120.51 90.77 140.60 167.58 122.71 45.84 26.28 34.04 43.80 31.03 26.36 114.02 140.24 186.33
Ni 206.11 1870.00 263.62 848.89 171.65 340.62 868.07 625.18 987.55 1200.00 932.36 294.24 242.35 308.28 388.20 323.97 284.64 1630.00 2130.00 1850.00
Cu 33.84 33.47 38.54 31.44 66.74 23.59 26.04 -10.00 12.74 -10.00 47.15 49.66 16.51 30.34 38.41 21.00 31.30 -10.00 40.50 -10.00
Zn 69.68 109.52 45.05 104.97 37.07 -30.00 161.19 37.59 109.79 101.21 107.47 41.18 -30.00 -30.00 33.09 36.37 -30.00 46.46 105.11 88.61
Ga 12.22 5.41 15.18 5.96 16.65 4.22 6.69 4.93 6.11 3.92 6.24 7.52 11.07 8.54 5.55 5.77 8.08 2.55 1.62 1.33
Ge 1.45 1.57 1.81 1.72 1.53 -0.50 1.42 0.40 1.59 1.62 1.38 2.36 1.57 1.99 2.35 2.59 1.05 1.44 1.17 1.15
As -5.00 -5.00 -5.00 -5.00 -5.00 -5.00 -5.00 -5.00 -5.00 -5.00 -5.00 -5.00 -5.00 -5.00 -5.00 -5.00 -5.00 -5.00 -5.00 -5.00
Rb 46.16 8.97 11.98 3.02 10.19 3.15 4.58 3.43 4.21 1.33 7.59 11.12 8.74 19.37 3.84 3.96 13.72 1.65 1.84 -1.00
Sr 289.88 63.34 209.62 40.69 231.03 67.95 61.93 72.48 58.31 22.24 85.97 107.41 181.81 156.12 34.37 64.85 165.89 23.66 4.08 -2.00
Y 10.55 5.37 15.97 7.14 15.45 4.20 4.30 3.67 4.18 4.12 4.27 9.81 4.22 6.48 9.27 5.19 4.35 2.51 0.89 -0.50
Zr 20.74 13.18 29.70 18.89 33.66 11.01 12.15 9.18 8.35 21.32 8.74 9.75 5.40 7.81 15.06 4.89 5.97 3.26 3.33 1.31
Nb 1.08 1.17 1.63 0.84 2.14 0.78 0.89 0.74 0.69 0.66 0.66 0.64 0.43 0.52 0.75 0.34 0.50 0.43 0.35 0.37
Mo -2.00 12.87 -2.00 -2.00 -2.00 -2.00 -2.00 2.00 -2.00 -2.00 9.34 -2.00 -2.00 -2.00 -2.00 6.57 -2.00 -2.00 11.08 -2.00
Ag -0.50 1.09 -0.50 -0.50 -0.50 -0.50 1.71 -0.50 -0.50 -0.50 -0.50 -0.50 -0.50 -0.50 -0.50 -0.50 -0.50 -0.50 -0.50 -0.50
In -0.10 -0.10 -0.10 -0.10 -0.10 -0.10 -0.10 -0.10 -0.10 -0.10 -0.10 -0.10 -0.10 -0.10 -0.10 -0.10 -0.10 -0.10 -0.10 -0.10
Sn -1.00 -1.00 -1.00 -1.00 -1.00 -1.00 -1.00 -1.00 -1.00 2.33 -1.00 -1.00 -1.00 -1.00 -1.00 1.34 -1.00 -1.00 -1.00 -1.00
Sb -0.20 0.23 0.25 -0.20 -0.20 -0.20 0.78 -0.20 -0.20 -0.20 11.94 -0.20 -0.20 -0.20 -0.20 0.21 -0.20 -0.20 -0.20 -0.20
Cs 0.24 0.26 0.27 0.11 0.12 -0.10 -0.10 0.14 -0.10 -0.10 0.27 0.15 0.13 0.20 0.16 0.31 0.11 -0.10 -0.10 -0.10
Ba 256.52 144.70 157.36 96.30 185.71 192.66 198.29 186.85 157.28 68.31 205.49 110.72 65.21 120.96 45.87 46.43 129.95 34.70 11.39 5.56
La 2.51 2.59 2.55 1.27 3.71 1.24 1.55 1.29 1.98 0.88 1.10 1.63 0.79 1.00 1.66 0.53 0.74 0.45 0.23 -0.05
Ce 4.07 4.95 7.14 2.88 11.79 2.57 3.13 2.36 2.59 1.88 2.28 3.10 1.85 2.50 4.15 1.44 1.86 0.98 0.66 0.09
Pr 0.58 0.54 1.14 0.40 1.81 0.36 0.38 0.30 0.34 0.26 0.27 0.52 0.26 0.37 0.57 0.20 0.25 0.14 0.06 0.01
Nd 2.79 2.50 5.46 1.96 8.42 1.54 1.67 1.31 1.50 1.31 1.42 2.65 1.39 2.08 2.89 1.24 1.33 0.66 0.34 0.06
Sm 0.78 0.63 1.49 0.67 2.12 0.45 0.46 0.37 0.38 0.41 0.43 0.91 0.45 0.69 0.96 0.48 0.45 0.25 0.09 0.03
Eu 0.37 0.25 0.66 0.30 0.83 0.22 0.24 0.20 0.21 0.13 0.20 0.35 0.27 0.29 0.35 0.20 0.23 0.10 0.05 -0.01
Gd 1.03 0.75 1.89 0.87 2.28 0.54 0.57 0.46 0.54 0.53 0.55 1.28 0.59 0.91 1.32 0.65 0.61 0.35 0.11 0.03
Tb 0.20 0.14 0.37 0.18 0.42 0.12 0.11 0.10 0.10 0.11 0.10 0.25 0.12 0.19 0.26 0.14 0.13 0.07 0.02 -0.01
Dy 1.27 0.94 2.30 1.15 2.62 0.70 0.74 0.61 0.62 0.69 0.71 1.59 0.77 1.16 1.63 0.91 0.81 0.43 0.14 0.04
Ho 0.26 0.19 0.49 0.25 0.55 0.15 0.14 0.12 0.13 0.15 0.15 0.34 0.16 0.25 0.33 0.19 0.16 0.09 0.03 -0.01
Er 0.83 0.64 1.59 0.80 1.72 0.51 0.51 0.41 0.42 0.49 0.47 1.00 0.46 0.73 1.02 0.60 0.48 0.28 0.10 0.03
Tm 0.11 0.09 0.22 0.11 0.24 0.07 0.07 0.06 0.06 0.08 0.07 0.13 0.07 0.11 0.14 0.08 0.07 0.04 0.02 0.01
Yb 0.65 0.59 1.32 0.73 1.50 0.44 0.49 0.38 0.38 0.44 0.42 0.79 0.39 0.60 0.84 0.47 0.40 0.25 0.10 0.04
Lu 0.10 0.08 0.20 0.11 0.23 0.07 0.07 0.06 0.06 0.08 0.07 0.12 0.06 0.09 0.13 0.07 0.06 0.04 0.01 0.01
Hf 0.56 0.40 0.88 0.51 0.98 0.32 0.36 0.26 0.25 0.55 0.28 0.37 0.20 0.29 0.50 0.20 0.21 0.12 -0.10 -0.10
Ta 0.04 0.05 0.09 0.03 0.14 0.07 0.03 0.03 0.03 0.02 0.03 0.02 -0.01 -0.01 0.03 -0.01 0.01 0.02 -0.01 -0.01
W -0.50 -0.50 -0.50 -0.50 -0.50 -0.50 -0.50 -0.50 -0.50 -0.50 -0.50 -0.50 -0.50 -0.50 -0.50 -0.50 -0.50 -0.50 22.78 -0.50
Tl 0.11 -0.05 -0.05 -0.05 -0.05 -0.05 -0.05 -0.05 -0.05 -0.05 -0.05 -0.05 -0.05 0.05 -0.05 -0.05 -0.05 -0.05 -0.05 -0.05
Pb 28.35 39.54 -5.00 -5.00 -5.00 -5.00 -5.00 -5.00 -5.00 -5.00 19.53 5.72 -5.00 -5.00 -5.00 15.02 -5.00 -5.00 36.16 -5.00
Bi -0.10 0.24 -0.10 -0.10 -0.10 -0.10 0.20 -0.10 -0.10 -0.10 0.11 -0.10 -0.10 -0.10 -0.10 -0.10 -0.10 -0.10 -0.10 -0.10
Th 0.37 0.37 0.81 0.23 1.44 0.18 0.22 0.12 0.16 0.17 0.16 0.21 0.05 0.13 0.33 0.05 0.16 0.07 0.05 -0.05
U 0.10 0.26 0.17 0.07 0.23 0.07 0.14 0.05 0.06 0.07 0.04 0.05 0.02 0.04 0.10 0.04 0.04 0.03 0.03 0.02
Major element oxides in weight percent, trace elements in parts per million; total iron reported as Fe2O3
LOI: loss on ignition
Rock code: Du dunite, Cpxt Clinopyroxenite, Gb gabbro, Per Peridotite, Pl-Per Plagioclase- Peridotite
* Indicated location (meters) in Fig. 11
Table 02 – Whole-rock analyses of representative samples from the Serra do Puma Complex.

38
Figure 14 - Plot of Mg# versus selected major and minor element contents for rocks of the Serra da Onça
and Serra do Puma complexes. Data from Table 1 and Table 2.

39
Figure 15 - Plot of MgO versus CaO contents for pyroxenites and gabbroic rocks of the Serra da Onça and
Serra do Puma complexes. Data from Table 1 and Table 2. Field of plagioclase is based upon microprobe
data for cumulus plagioclase from both complexes (reported in this study). Thick solid lines indicate the
cristalization sequence for the SOC (bluish color) and SPC (reddish color) complexes.
7.2 Trace Elements
The contents of incompatible trace elements in the mafic-ultramafic rocks of the
SOC and SPC are generally low (Tables 1 and 2), as expected for cumulates consisting
mainly by olivine, pyroxene and plagioclase. Variations in contents of incompatible
trace elements in mafic-ultramafic cumulates in layered complexes result from the
combined effect of variable assemblages of cumulate minerals, fractionation of the
parental magma and variable amounts of trapped intercumulus liquid (Barnes, 1986;
Ferreira Filho et al., 1998). Mafic-ultramafic rocks of the SOC and SPC are
predominantly adcumulates, such that the amount of incompatible trace elements
contained in cumulate minerals is relevant for their concentration in these rocks.
Therefore, results for trace elements are considered for different types of cumulate rocks.
Distinct mantle-normalized rare earth element (REE) profiles characterize
different cumulate rocks of the SOC and SPC (Fig. 16). REE profiles for
clinopyroxenites (Cpx cumulate) of the SPC and orthopyroxenites (Opx cumulate) of the
SOC indicate the significance of different cumulate minerals in the distribution of REE

40
in these rocks (Fig. 16B). Because partition coefficients of REE for Cpx are significantly
higher than Opx (Godel et al., 2011; Ferreira Filho et al., 1998), clinopyroxenites of the
SPC have significantly higher REE contents when compared with orthopyroxenites of
the SOC. Therefore, different REE contents and REE profiles for pyroxenites of the
SOC and SPC should be evaluated considering the effect of different cumulus minerals.
The same reasoning should be used when considering the distribution of REE of
gabbroic rocks of the SOC and SPC (Fig. 16A). Gabbroic rocks of the SOC and SPC
have similar amounts of plagioclase but consist of different propostions of Cpx and Opx.
REE profiles for gabbroic rocks of the SOC (Opx+Cpx+Pl cumulates) have positive
slopes for LREE and HREE (i.e. progressive enrichment toward lighter REE) and very
distinct positive Eu anomalies (Fig. 16A). On the other hand, REE profiles for gabbroic
rocks of the SPC (Cpx+Pl cumulates) have flat to slightly positive slopes for LREE,
mainly flat HREE profile and discrete positive Eu anomalies (Fig. 16A). Different REE
profiles for gabbroic rocks of the SOC and SPC result in distinct La/Sm and Gd/Yb
ratios (Fig. 17). Because the modal proportion of Cpx is higher in gabbroic rocks of the
SPC than gabbroic rocks from the SOC, these differences should partially result from
distinct modal proportions. However, plots of La/Sm vs Ce and La/Sm vs Yb (Fig. 18)
indicate that higher La/Sm ratios for gabbroic samples of the SOC compared with
gabbroic samples of the SPC are independent of the total amount of REE elements.
These indicate that higher La/Sm ratios of the SOC gabbroic rocks should not result just
of distinct modal proportion of Cpx, and distinct compositions of parental magmas for
the SOC and SPC should be involved. The conclusion derived from this reasoning
indicates that the parental magma of the SOC has a relatively higher La/Yb ratio
compared to the parental magma of the SPC.
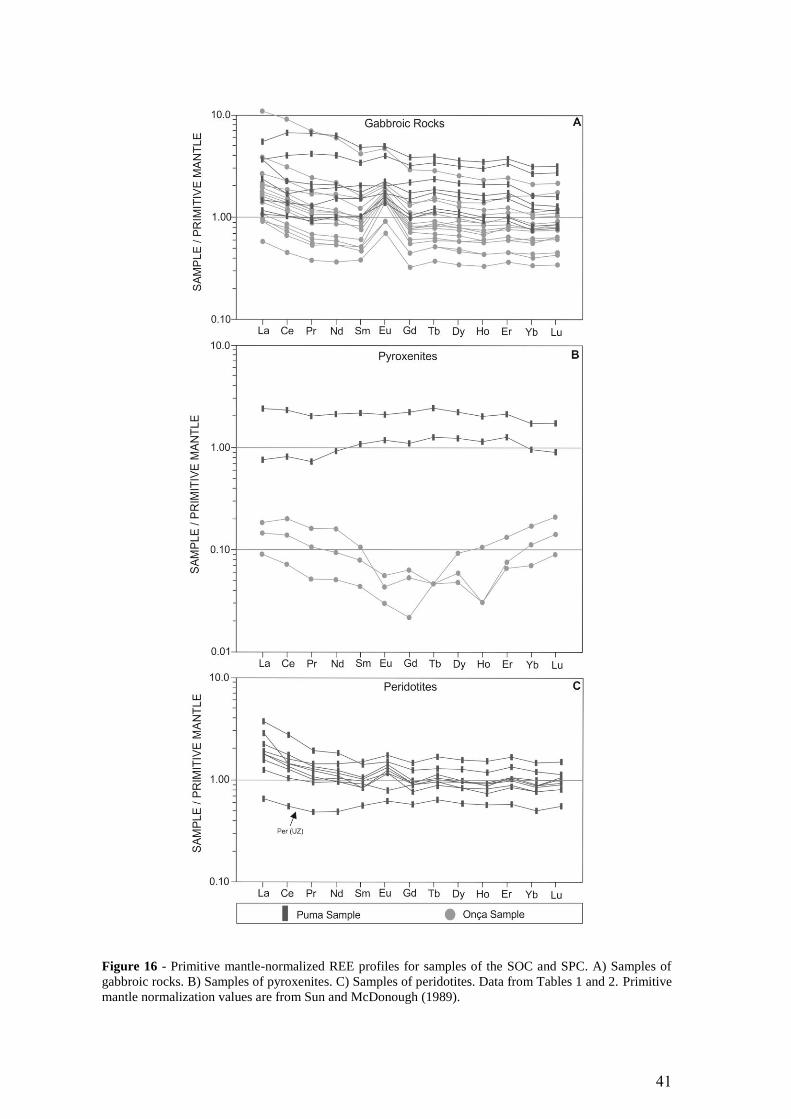
41
Figure 16 - Primitive mantle-normalized REE profiles for samples of the SOC and SPC. A) Samples of
gabbroic rocks. B) Samples of pyroxenites. C) Samples of peridotites. Data from Tables 1 and 2. Primitive
mantle normalization values are from Sun and McDonough (1989).

42
Figure 17 - Gd/Yb vs La/Sm plot for gabbroic rocks of the SOC and SPC. Same samples plotted in Fig.
16A.

43
Figure 18 - La/Sm vs Ce and La/Sm vs Yb plots for gabbroic rocks of the SOC and SPC. Same samples
plotted in Fig. 16A.
Contents for several highly incompatible high field strength cations, including
Ta, Nb, Th and Hf, in cumulate rocks of the SOC and SPC are close to or below
detection limits for most samples, especially for dunites and peridotites (Table 1 and 2).
To avoid scattering due to results close to detection limits, mantle-normalized lithophile
trace element profiles of the SOC and SPC are plot just for gabbroic rocks with higher
contents of incompatible trace elements (Fig. 19A and 19B). These profiles are very
similar and are consistent with profiles obtained for rocks with lower trace element
contents, including peridotites and pyroxenites. Distinct profiles are restricted to samples
of ilmenite-magnetite bearing gabbronorites of the SOC, which are characterized by

44
significant Ti anomalies. Mantle-normalized alteration-resistant trace element profiles
are more fractionated for gabbroic samples of the SOC, as indicated by relative
enrichment in LREE (Fig. 19A). Gabbroic samples from the SOC and SPC have
pronounced negative Nb and Ta anomalies (Fig. 19). It is worth to mention that Nb and
Ta anomalies are more significant for the SOC compared to the SPC, which reflects the
relative enrichment of LREE in samples of the SOC. Very similar mantle-normalized
lithophile trace element profiles for the SOC and SPC rocks suggest that cumulate rocks
from both complexes crystallized from parental magmas with similar contents of
incompatible elements.
Figure 19 - Primitive mantle-normalized alteration-resistant trace elements profiles for samples of
gabbroic rocks of the SOC and SPC. Data from Tables 1 and 2. Primitive mantle normalization values are
from Sun and McDonough (1989).

45
8 U-Pb and Sm-Nd isotopes
8.1 U-Pb geochronology
Extensive sampling for zircon U-Pb geochronology was carried on in the SOC
(07 samples), SPC (02 samples) and smaller nearby layered complexes (01 sample of the
Carapanã complex and 02 samples of the Guepardo Complex). Sampling was focused on
fractionated gabbroic rocks, including pegmatoidal facies representing clusters enriched
in trapped residual liquid, as well as orthocumulate peridotites. Out of 12 samples
collected, just one sample from the SPC produced a concentrate of minerals (zircons)
appropriated for U-Pb geochronology. U-Pb isotope data for this sample (SC68) are
presented in Table 3. Sample SC68 corresponds to a pegmatoid gabbro of the SPC,
interpreted as representative of the most evolved rocks of the LZ. This pegmatoidal
gabbro occurs as an irregular pod within medium-grained gabbro. Except for the coarser
grain size and minor interstitial quartz, sample SC68 is similar to gabbroic rocks of the
Layered Zone of the SPC
U-Pb isotopic analyses of zircon crystals render several concordant to slightly
discordant U-Pb dates (Table 3; Fig. 20). Twenty-two spot analyses define a Discordia
line with an upper intercept age of 2713±30 Ma (MSWD=6.5). This age is interpreted as
the crystallization age of zircons and, therefore, the age of magmatic crystallization of
the SPC.

46
Table 03 - U-Pb LA-MC-ICPMS data for sample SC68.
Figure 20 - LA-MC-ICPMS U-Pb plot for sample SC68. See text for explanation.

47
8.2 Sm-Nd systematics
The Sm-Nd isotopic data of the SOC and SPC are listed in Table 04. Nd isotopic
data obtained for different mafic (gabbro, leucogabbro, gabbro pegmatoid) and
ultramafic (clinopyroxenite, plagioclase peridotite and peridotite) lithotypes of the SPC
render variably positive to negative εNd (T=2.77 Ga) values (-3.56 to 2.41). Plotted
against the stratigraphy, the Sm–Nd data of the SPC are scattered and do not correlate
with the layering sequence or the fractionation trend. Peridotites of the SPC generally
have more negative εNd (T=2.77 Ga) values (-3.56 to -0.64) than interlayered gabbroic
rocks (-2.47 to 2.41) (Fig. 21). Nd isotopic data for gabbronorite and Mag gabbronorite
of the SOC have negative εNd (T=2.77 Ga) values (-3.33 to -2.12). Plotted against the
stratigraphy, the Sm–Nd data of the SOC are scattered and do not correlate with the
layering sequence or the fractionation trend. Compared with isotopic data of the SPC,
gabbroic rocks of the SOC have more negative and less variable εNd (T=2.77 Ga) values
as well as generally higher La/Sm and Ce/Nb ratios (Fig. 21).
Table 04 - Sm–Nd isotopic data for the SOC and SPC.

48
Figure 21 - εNd (T=2.77 Ga) vs Ce/Nb and La/Sm and εNd (T=2.77 Ga) vs MgO plots for rocks of the SOC and
SPC. Data from Table 01, 02 and 04.

49
9 Discussion
9.1 Parental Magma
The characterization of the parental magmas of layered intrusions is of great
interest because this provide clues on the nature of the mantle source, the potential
assimilation of older crustal rocks and the prospectivity of an igneous suite to host
magmatic mineral deposits.
The composition of the parental magmas of the SOC and SPC is not constrained
by common approaches used to define their composition (e.g., chilled margin, bulk
composition, extrusive equivalents, related dykes, and melt inclusions), as illustrated by
several studies of extensively investigated layered intrusions (e.g. Cawthorn, 1996).
Whenever a direct composition of the parental magma is not possible in layered
intrusions, the nature of the parental magma has been inferred from the crystallization
sequences of the intrusions and the geochemistry of cumulate minerals and rocks (e.g.
Chai and Naldrett, 1992; Ferreira Filho et al. 1998; Godel et al. 2011). Distinct
crystallization sequences described for the SOC and SPC suggests that each complex
evolved from a different parental magma, and the reason behind the existence of such
difference becomes a relevant question as far as the characterization of magmatic suites
in the CMP is concerned. A very primitive composition (i.e., high MgO content) for the
parental magma of the SOC and SPC is indicated by the abundance of dunite and
peridotite, as well as the relatively high proportion of ultramafic rocks (about 50 %) in
the stratigraphy of both complexes. The compositional range of cumulus Ol within the
UZ of the SOC (Fo86.2-92.4) and the SPC (Fo88.6-87.7) supports a very primitive
composition for their parental magmas. It is worth remembering that due to extensive
weathering and/or serpentinization analyses of olivine crystals are limited to just one
sample of dunite from the UZ of the SPC (Fig. 12). Therefore, this composition should
not be considered as representative of the most primitive olivine of the SPC, and highly
primitive olivine compositions (~ Fo92) should be considered for both complexes.
Primitive compositions and similar compositional range for olivine of the UZ in both
complexes are supported by comparable bulk rock MgO and Ni contents for bedrock
dunite of Ni laterite deposits of the SOC and SPC, as indicated by systematic data
collected for resources evaluation. The composition of the most primitive cumulus Ol in
the SOC is comparable with those reported for the Great Dyke (Fo92 ; Wilson, 1982),
Niquelândia Complex (Fo93 ; Ferreira Filho and Araújo, 2009; Ferreira Filho et al. 2010)

50
and Ipueira-Medrado Sill (Fo93 ; Marques and Ferreira Filho, 2003), all of them
originated from highly primitive parental magmas.
Distinct crystallization sequences for the SOC (Ol+Chr > Opx+Chr > Opx >
Opx+Pl > Opx+Pl+Cpx) and SPC (Ol+Chr > Ol+Cpx+Chr > Cpx > Cpx+Pl >) indicate
that they follow different liquid lines of descent. The crystallization sequence of the SOC
is similar to those of the major PGE-bearing intrusions (e.g. Bushveld, Stillwater, Great
Dyke) in which Opx precedes Cpx (Eales and Cawthorn, 1996). The early crystallization
of Opx relative to Cpx in the SOC indicates that the primary magma was silica saturated,
whereas the absence of Opx as a cumulus mineral in the SPC suggests that the primary
magma was silica undersaturated. The origin of chemically distinct magmas, such as
those of the SOC and SPC, are interpreted in different ways, but these interpretations
converge along two trains of thought:
i. They are different primitive mantle melts and therefore should be considered as
part of two distinct magmatic suites in the CMP.
ii. They represent similar primitive mantle melt modified by variable
differentiation and contamination processes.
The contrasting processes cannot be readily distinguished using isotope and trace
element data. However, the broad similarity in the trace element data for the SOC and
SPC suggests that they were derived from a similar source, possibly followed by variable
contamination with crustal rocks, a subject to be addressed in the following topic.
9.2 Assimilation
Mantle-normalized alteration-resistant trace element profiles of gabbroic rocks of
the SOC and SPC are fractionated, as indicated by relative enrichment in LREE and Th,
with pronounced negative Nb and Ta anomalies (Fig. 19). Mantle-normalized negative
Nb and Ta anomalies are a characteristic feature for the upper and lower crust
(Wedepohl, 1995). The alteration-resistant element profiles obtained for the SOC and
SPC are comparable with average composition of the B1 rocks of the chilled margins of
the Bushveld Complex (Barnes et al., 2010). The B1 magma is interpreted as the product
of a mixture of a primitive mantle melt mixed with continental crust, and has been
successfully modeled as the parental magma of the cumulate rocks of Lower and Lower
Critical Zone of the Bushveld Complex (Barnes et al., 2010; Godel et al., 2011). The
distribution of alteration-resistant elements in the SOC and SPC is therefore consistent
with a mixture of a primitive mantle melt with continental crust. Mantle-normalized

51
negative Nb and Ta anomalies are more significant for the SOC compared to the SPC,
which partially reflects the relative enrichment of LREE in samples of the SOC (Fig. 17
and 18). Very similar mantle-normalized lithophile trace element profiles for the SOC
and SPC rocks suggest that cumulate rocks from both complexes crystallized from
parental magmas with similar contents of incompatible elements.
Additional evidence for crustal contamination of the parental magma of the SOC
and SPC is provided by Sm-Nd isotopic data (Table 04). Nd isotopic data obtained for
different rock types of the SPC render variably positive to negative εNd (T=2.77 Ga)
values (-3.56 to 2.41), while gabbroic rocks of the SOC have negative and less variable
εNd (T=2.77 Ga) values (-3.33 to - 2.12). Nd data of the SPC and SOC are scattered and
do not correlate with the layering sequence or the fractionation trend of these layered
complexes. These results are consistent with an original mantle melt variably
contaminated with older continental crust. Crustal contamination is expected for high
temperature and Mg-rich magmas, like the parental magmas of the SOC and SPC,
intruded into gneisses and migmatites of the ca. 3.0 Ga Xingu Complex. Compared with
isotopic data of the SPC, gabbroic rocks of the SOC have more negative and less
variable εNd (T=2.77 Ga) values as well as generally higher La/Sm and Ce/Nb ratios
(Fig. 21). These features are compatible with a higher proportion of crustal
contamination for layered rocks of the SOC compared with those of the SPC. However,
considering the data for each layered intrusion, εNd (T=2.77 Ga) values are poorly
correlated with La/Sm and Ce/Nb ratios (Fig. 21). Poor correlation between εNd (T=2.77
Ga) values with La/Sm and Ce/Nb ratios persists even if the data are limited to gabbroic
rocks, a group of samples likely to be less affected by compositional variations produced
by variable contents of REE in cumulate minerals.
The evaluation of the importance of crustal contamination based upon isotope
and trace element data of cumulate rocks is not straightforward. Because the
compositions of the parental magmas are not known (i.e., based on chilled margins or
volcanic equivalents) and the compositions of potential contaminants are poorly
constraint, the latter statement is particularly significant for the SOC and SPC. However,
the combined data thus suggest that the compositions of the parental magmas of the SOC
and SPC were derived from a similar source, followed by variable contamination with
crustal rocks, which are more significant for the SOC.

52
9.3 The petro-tectonic setting of the Serra da Onça and Serra do Puma layered
complexes
The 2713±30 Ma U-Pb zircon age obtained in this study for the SPC provides an
additional age for layered intrusions of the Carajás Mineral Province. Reported U-Pb
zircon ages for these layered intrusions (Fig. 22) indicate that they all have Neoarchean
ages broadly bracket between 2680-2780 Ma. U-Pb zircon ages for the Luanga (2763±6
Ma; Machado et al., 1991), Lago Grande (2722±53 Ma; Teixeira, 2013; Teixeira et al.,
submitted) and Serra da Onça (2766±6Ma; unpublished data reported by Lafon et al.,
2000) complexes overlap with precise ages of the bimodal volcanism of the Grão Pará
Group (2759±2 Ma, Machado et al., 1991; 2760±11 Ma, Trendall et al., 1998), thus
supporting the interpretation that mafic volcanics and mafic-ultramafic layered
intrusions resulted from coeval magmatic events (Machado et al., 1991; Ferreira Filho et
al., 2007). The age reported for the SPC in this study is younger than the ages reported
for the Grão Pará Group, as well as the Luanga and SOC complexes, thus indicating a
relatively younger intrusive event. Considering that the reported age of the SOC is based
upon unpublished zircon U-Pb SHRIMP data for one gabbroic sample, together with our
difficulties to get concentrate of minerals (zircons) appropriated for U-Pb geochronology
in seven investigated samples, the interpretation of reported ages for the SOC should be
considered with caution. Obtained results for the SOC and SPC may be interpreted in
two different ways:
i. The reported 2766±6Ma U-Pb zircon age corresponds to the magmatic age of
the SOC. Following this interpretation, the silica unsaturated and less contaminated
magma of the SPC would have intruded later than the SOC, thus representing a younger
intrusion compared to dated layered complexes and volcanics from the eastern portion of
the CMP (Fig. 22).
ii. The reported 2766±6Ma U-Pb zircon age corresponds to ages of inherited
zircons, eventually assimilated from syntectonic granites (ca 2.76-2.74 Ga; Dall'Agnol et
al. 1994; Avelar et al. 1999). Geological support for this alleged contamination is
provided the abundance of large Neoarchean granites (Plaquê plutons) in the area close
to the SOC and SPC (Fig. 02). This interpretation opens the possibility that younger ages
of mafic-ultramafic complexes may be a characteristic feature of the western portion of
the CMP, as indicated by the 2713±30 Ma age reported in this study.
These two contrasting interpretation are currently being investigated through
additional sampling for U-Pb geochronology of several layered intrusions in the western

53
portion of the CMP. At this point in time we suggest that the layered intrusions of the
CMP are part of a major Neoarchean (ca 2.76 Ga) magmatic event, which has a spread
of ages that still need to be fully investigated. Based on recent U-Pb zircon ages obtained
for layered intrusions of the CMP (summarized in Fig. 22), we suggest that the alleged
2.4 Ga Cateté Event indicated in the LIP Commission (www.largeigneousprovinces.org)
should be reported a Neoarchean event (ca 2.76 Ga).
Figure 22 - Summary of U-Pb zircon ages, Fo contents of olivine and Sm-Nd isotopes for layered
intrusions of the CMP. Data from the following references: Lago Grande (Teixeira, 2013; Teixeira et al.,
submitted); Luanga (Machado et al., 1991; Ferreira Filho et al., 2007); Luanga and Puma (this study),
Grão Pará (Machado et al. 1991; Trendall et al., 1998).
The location of the layered complexes in the CMP is controlled by major regional
faults, a feature that is particularly evident in aerogeophysical features along EW (e.g.
Canaã shear zone) and NE-SW (e.g. MacCandles shear zone) trends (Fig. 1 and 23).
Geophysical features associated with these regional trends are interrupted or largely
attenuated in areas covered by the Itacaiúnas Supergroup, Aquiri Group and Águas Clara
Formation, indicating that they represent dip crustal discontinuities older than the
Neoarchean supra-crustal sequences (Fig. 23). The larger and most primitive layered
intrusions in the CMP (e.g. SOC, SPC, Vermelho Complex and Serra do Jacaré
Complex), all of them characterized by a thick pile of ultramafic rocks and world class
Ni-laterite resources, are emplaced within older terrains of the Xingú Complex. These
intrusions were located along dip crustal discontinuities that represent preferred sites of
location of magma transferred from the mantle to the crust.
The assimilation of older continental crust during the ascent and/or emplacement
of the mafic-ultramafic magma of the SOC and SPC (this study), as well as the Lago

54
Grande Complex (Teixeira, 2013; Teixeira et al., submitted), is suggested by trace
element contents and Sm-Nd isotopes. Fo contents for layered complexes summarized in
Figure 22 indicate highly to moderately primitive compositions, while negative εNd
(T=2.77 Ga) values suggest contamination with old silaic crust. This suggestion is
consistent with a large volume of primitive to moderately primitive magma being
transferred through continental crust in the Carajás region. This is expected if mafic-
ultramafic magmatism in Carajás is associated with intra-plate rifting of older
continental crust (Gibbs et al., 1986; Olszewski et al., 1989; Villas and Santos, 2001).

55
Figure 23 - A) Analytical signal image for the CMP (geophysical data processes from PGBC and Carajás 1 regional surveys). B) Geological map of the CMP (see captions in
Fig. 1).

56
9.4 The potential for Ni-Cu-PGE deposits
Large events of mafic-ultramafic magmatism are responsible for the
concentration of most world-class Ni-Cu-PGE deposits in the world (Naldrett 2004,
and references therein). Apart from the abundance of mafic-ultramafic intrusions of
different compositions and sizes in the CMP, reported magmatic Ni-Cu-PGE
mineralization is so far limited to PGE resources (with no disclosed figures) in the
Luanga and SOC complexes (Ferreira Filho et al., 2007). The CMP has been exposed
to moderate exploration for Ni-Cu-PGE deposits in the last decade, such that the
paucity of primary Ni-Cu-PGE mineralization in the region cannot be credit solely to
underexploration anymore. Therefore, the prospectivity of the CMP for Ni-Cu-PGE
deposits should now be considered taking into account previous results obtained for
investigated layered complexes and the exploration tools applied. In broad terms past
exploration for Ni-Cu-PGE deposits in the CMP has been focused on results provided
by regional surveys (e.g. stream sediments, different aerogeophysical surveys) or
detailed investigation of exposed large layered intrusions. The latter has been mainly
targeted for reef type PGE deposits, as illustrated by the Luanga and Serra da Onça
complexes (Ferreira Filho et al., 2007). Future exploration should move toward
smaller or covered/poorly exposed intrusions, as well as the application of new
exploration tools or models.
10. Conclusions
The main conclusions of this study are as follows:
1. Despite the geographical proximity and similarity in tectonic
environment of the SOC and SPC, they have different sequence of
magmatic crystallization. The SOC follows a crystallization sequence
consisting of Ol+Chr > Opx+Chr > Opx > Opx+Pl > Opx+Pl+Cpx,
whereas the crystallization sequence of the SPC consists of Ol+Chr >
Ol+Cpx+Chr > Cpx > Cpx+Pl.
2. The abundance of ultramafic rocks (dunite and peridotites) and the
composition of cumulus olivine (up to Fo92) indicate very primitive
parental magma for both complexes.
3. The early crystallization of Opx relative to Cpx in the SOC indicates
that the primary magma was silica saturated, whereas the absence of

57
Opx as a cumulus mineral in the SPC suggests that the primary magma
was silica undersaturated.
4. Whole rock analytical results for the major elements reflect the relative
abundance of cumulus minerals of each complex, and are consistent
with distinct crystallization sequences for the SOC and SPC.
5. Very similar mantle-normalized lithophile trace element profiles for
the SOC and SPC rocks suggest that cumulate rocks from both
complexes crystallized from parental magmas with similar contents of
incompatible elements.
6. The enrichment in LREE and mantle-normalized negative Nb and Ta
anomalies, suggest a contamination of the primitive parental magma by
continental crust.
7. Both complexes have highly variable negative values of εNd (T = 2.77
Ga), but gabbroic rocks of the SOC (εNd (T = 2.77 Ga) = -3.33 to -
2.12) are more negative and less variable than the values for the SPC
(εNd (T=2.77 Ga) = -2.47 to 2.41).
8. The combinations of several evidences suggest that the parental
magma of both complexes is derived from a similar source, followed
by a variable contamination by continental crust that is more
significant in the SOC.
9. The 2713±30 Ma age reported for the SPC in this study is younger than
the ages reported for the Grão Pará Group, as well as the Luanga
complex, thus indicating a relatively younger intrusive event in the
western portion of the CMP.
10. The large mafic-ultramafic intrusions of the CMP emplaced into deep
crustal discontinuities. During the ascension process, variables
contents of oldest continental crust are assimilated. This is expected if
mafic-ultramafic magmatism in Carajás is associated with intra-plate
rifting of older continental crust.
11. The abundance of primitive crustal contaminated layered intrusions in
the CMP indicates a high potential for magmatic Ni-Cu-PGE deposits
in this reagion.

58
Acknowledgments
This study was supported by CNPq (Conselho Nacional de Desenvolvimento
Científico e Teconológico) and VALE S.A. (Projeto 550398/2010-4). Analytical
facilities of the Instituto de Geociências of the University of Brasília (UnB) provided
additional support for this research. The authors acknowledge Fernando Martins
Matos, Lincoln Siepierski, Samuel Nunes and Denisson Oliveira from VALE for their
support during fieldwork and interpretation of exploration data, as well as stimulating
discussions on the geology of the Carajás Mineral Province. Cesar F. Ferreira Filho is
a Research Fellow of CNPq since 1996, and acknowledges the continuous support
through research grants and scholarships for the "Metalogenênese de Depósitos
Associados ao Magmatismo Máfico-Ultramáfico" Research Group. This study is part
of the first author's (Wolney Dutra Rosa) M.Sc dissertation developed at the Instituto
de Geociências (UnB).
References
Albarede, F. et al., 2004. Precise and accu-rate isotopic measurements using multi-ple
collector ICPMS. Geochimica et Cosmochimica Acta, 68: 2725-2744.
Araújo, O.J.B., Macambira, E.M.B., Vale, A.G., Oliveira, J.R., Silva Neto, C.S., Costa, E.J.,
Santos, A., Pena Filho, J.I de C., Neves, A.P., João, X.S.J., Costa, J.B.S. 1994. Primeira
integração das investigações geológicas do programa Grande Carajás na região SE do
Estado do Pará, in Simpósio Geologia Amazônica, 4, Belém, 299-300.
Araújo, O.J.B., Maia, R.G.N. 1991. Programa Grande Carajás, Serra dos Carajás, Folha
SB.22-Z-A, Estado do Pará. DNPM-CPRM. Brasília.
Araújo, O.J.B., Maia, R.G.N., João, X.S.J., Costa, J.B.S. 1988. A megaestruturação arqueana
da Folha Serra dos Carajás: in Congresso Latino Americano de Geologia, Anais, 324-
338, Belém, Brasil.
Avelar, V.G., Lafon, J.M., Correia J.R., FC, Macambira, E.M.B. 1999. O magmatismo
arqueano da região de Tucumã-Provínica Mineral de Carajás: Novos dados
geocronológicos, Revista Brasileira de Geociências, 453-460.
Barnes, S.J., 1986. The effect of trapped liquid crystallization on cumulus mineral

59
compositions in layered intrusions. Contributions to Mineralogy and Petrology, v. 93,
524–531.
Barnes, S.-J., Maier, W.D., Curl, E.A., 2010. Composition of the marginal rocks and sills of
the Rustenburg Layered Suite, Bushveld Complex, South Africa: implications for the
formation of the platinum-group element deposits. Economic Geology, v. 105, 1491-
1511.
Barros, C.E.M., Sardinha, A.S., Barbosa, J.P.O., Krimski, R. and Macambira, M.J.B. 2001.
Pb–Pb and U–Pb zircon ages of Archean syntectonic granites of the Carajás metallogenic
province, northern Brazil: in South American Symposium on Isotopic Geology, 3,
Proceedings, 94-97.
Buhn B., Pimentel M.M., Matteini M., Dantas E.L. 2009. High spatial resolution analysis of
Pb and U isotopes for geochronology by laser ablation multi-collector inductively
coupled plasma mass spectrometry (LAMC- ICP-MS). Anais da Acad. Bras. de
Ciências, 1:1-16.
Chai G. and Naldrett A.J., 1992. Characteristics of Ni–Cu–PGE mineralization and genesis of
the Jinchuan deposit, northwest China. Economic Geology, 47:1475–1495
Cawthorn, R.G., 1996. Layered intrusions. Developments in Petrology, v. 15, Elsevier, 531
pp.
Dall’Agnol, R., Lafon, J.M. and Macambira, M.J.B., 1994. Proterozoic anorogenic
magmatism in the Central Amazonian Province, Amazonian Craton: geochronological,
petrological and geochemical aspects. Mineral Petrol 50:113–118
DePaolo, DJ. Neodymium isotopes in the Colorado front rage and implications for crust
formation and mantle evolution in the Proterozoic. Nature; 1981. p. 193-197.
Diella V., Ferrario A., Girardi V.A.V. 1995. PGE and PGM in the Luanga mafic ultramafic
intrusion in Serra dos Carajás (Pará State, Brazil). Ore Geology Reviews, 9, 443-453.
Docegeo - Rio Doce Geologia e Mineração. 1988. Revisão Litoestratigráfica da Província
Mineral de Carajás. In: Congresso Brasileiro de Geologia, 11-59.
Eales, H.V. and Cawthorn, R.G., 1996. The Bushveld Complex. In: Cawthorn, R.G. (Ed.),
60
Layered Intrusions. Developments in Petrology, vol. 15. Elsevier Science B. V., pp. 181–
229.
Ernst and Buchan, 2001; LIP Commission database at www.largeigneousprovinces.com
Ferreira Filho, C.F., Araujo, S.M., 2009. Review of Brazilian chromite deposits associated
with layered intrusions: geological and petrological constraints for the origin of
stratiform chromitites: Applied Earth Sciences (Trans. Inst. Min. Metall. B), v. 118, 86-
100.
Ferreira Filho, C.F., Cançado, F., Correa, C., Macambira, E.M,B., Siepierski, L., Junqueira-
Brod, T. C. 2007. Mineralizações estratiformes de EGP-Ni associadas a complexos
acamadados em Carajás: os exemplos de Luanga e Serra da Onça, in Contribuições à
Geologia da Amazônia, Sociedade Brasileira de Geologia - Núcleo Norte, 01-14.
Ferreira Filho, C.F., Naldrett, A.J. and Gorton, M.P., 1998. REE and pyroxene compositional
variation across the Niquelândia layered intrusion, Brazil: petrological and
metallogenetic implications. Applied Earth Sciences (Trans. Inst. Min. Metall. B) 107, 1-
22.
Ferreira Filho, C.F., Pimentel, M.M., Araujo, S.M., and Laux, J.H., 2010. Layered intrusions
and volcanic sequences in Central Brazil: Geological and geochronological constraints
for Mesoproterozoic (1.25 Ga) and Neoproterozoic (0.79 Ga) igneous associations.
Precambrian Research, v. 183, p. 617−634.
Gibbs, A.K., Wirth, K.R., Hirata, W.K., Olszewski Jr, W.J. 1986. Age and composition of the
Grão Pará Group volcanics, Serra dos Carajás: Revista Brasileira de Geociências, 201-
211.
Gioia, SMCL, Pimentel, MM. The Sm-Nd isotopic method in the geochronology laboratory
of University of Brasilia. Anais da Academia Brasileira de Ciências; 2000. p. 219-245.
Godel G., Sarah-Jane Barnes S-J. and Maier, W.D., 2011. Parental magma composition
inferred from trace element in cumulus and intercumulus silicate minerals: An example
from the Lower and Lower Critical Zones of the Bushveld Complex, South-Africa.
Lithos 125, 537–552
Holdsworth, R.E., Pinheiro, R.V.L. 2000. The anatomy of shallow-crustal transpressional
structures: insights from the Archean Carajás fault zone, Amazon, Brazil, Journal

61
Structural Geology, 1105-1123.
Huhn, S.R.B., Santos, A.B.S., Amaral, A.F., Ledsham, E.J., Gouveia, J.L., Martins, et al.
1988. O terreno granito-greenstone da região de Rio Maria-Sul do Pará: in Congresso
Brasileiro de Geologia, 35, Anais, Sociedade Brasileira de Geologia, 1438-1452.
Jackson, SE, Pearson, NJ, Griffin, WL, Belousova, EA. The application of laser ablation
inductively coupled plasma mass spectrometry to in situ U-Pb zircon geochronology.
Chemical Geology; 2004. p. 47-69.
Lafon J.M., Macambira M.J.B., Pidgeon R.T. 2000. Zircon U-Pb SHRIMP dating of
Neoarchean magmatism in the southwestern part of the Carajás Province (eastern
Amazonian Craton, Brazil). In: International Geological Congress, 30, Abstract Volume,
CD-ROM.
Latypov, R.M., 2003. The origin of marginal compositional reversals in basic-ultrabasic sills
and layered intrusions by Soret fractionation. Journal of Petrology 44, 1579-1618.
Ludwig, K.R., 2001. Users Manual for Isoplot/Ex version 2.47. A geochronological toolkit
for Microsoft Excel. Berkeley Geochronology Center Special Publication 1a, 55p.
Macambira, E.M.B. 1997. Geologia e aspectos metalogenéticos dos elementos do Grupo
Platina no Complexo Máfico-ultramáfico da Serra da Onça, Sul do Pará. Tese de
Mestrado. Universidade Federal do Pará – UFPA, Pará, Brasil.
Macambira E.M.B. and Ferreira Filho C.F., 2002. Fracionamento Magmático dos Corpos
Máfico-Ultramáficos da Suíte Intrusiva Cateté – Sul do Pará. In: Klein E.L., Vasquez
M.L. & Rosa Costa L.T. (eds.) Contribuições à Geologia da Amazônia v. 3. SBG-Núcleo
Norte, pp. 105-114.
Macambira, E. M. B., Jorge João, X. da S. and Souza, E. C. 1996. Aspectos Geológicos e
Petroquímicos do Granito Plaquê - Sul do Estado do Pará. Symposium Archean terranes
of the South American plataform, Brasília, Extended Abstracts, 73-75.
Macambira, M. J. B. and Lafon, J.M. 1995. Geocronologia da Síntese dos Dados e Novos
Desafios. Boletim do Museu Paraense Emílio Goeldi, 7, 263-288.
Macambira E.M.B. and Vale G., 1997. Programa Levantamentos Geológicos Básicos do
Brasil. São Felix do Xingu. Folha SB.22-Y-B. Estado do Pará. Brasília. DNPM/CPRM.
384pp.

62
Machado, W., Lindenmayer, Z.G., Krogh, T.E., and Lindenmayer, D. 1991. U-Pb
geochronology of Archean magmatism and basement reactivation in the Carajás area,
Amazon shield, Brazil. Precambrian Research, 329-354.
Marques, J.C. and Ferreira Filho, C.F., 2003. The chromite deposits of the Ipueira-Medrado
Sill, Bahia, Brazil. Economic Geologt, v. 98, 87–108.
McBirney, A.R., 1996. The Skaergaard Intrusion. In: Cawthorn, R.G. (Ed.), Layered
Intrusions. Developments in Petrology, vol. 15. Elsevier Science B. V., pp. 147–180.
McCallum, I.S., 1996. The Stillwater Complex. In: Cawthorn, R.G. (Ed.), Layered Intrusions.
Developments in Petrology, vol. 15. Elsevier Science B. V., pp. 441–483.
Naldrett, A.J., 2004, Magmatic sulfide deposits: Geology, Geochemistry and Exploration:
Heidelberg, Springer Verlag, 728 pp.
Olszewski, W.J., Wirth, K.R., Gibbs, A.K. and Gaudette, H.E., 1989. The age, origin, and
tectonics of the Grão Pará Group and associated rocks, Serra dos Carajás, Brazil:
Archean continental volcanism and rifting. Precam. Res. 42, 229–254.
Rivalenti, G., Mazzucchelli, M., Gerardi, V.A.V., Cavazzini, G., Finatti, C., Barbieri, M.A.,
Texeira, W. 1998. Petrogenesis of the Paleoproterozoic basalt–andesite–rhyolite dyke
association on the Carajás region, Amazonian craton. Lithos, 235-265.
Santos, J.O.S., Groves, D.I., Hartmann, L.A., Moura, M.A., Mc-Naughton, N.J. 2001. Gold
deposits of the Tapajós and Alta Floresta domains, Tapajós-Parima orogenic belt,
Amazon craton, Brazil: Mineralium Deposita, 278-299.
Simkin, T. and Smith, J.V., 1970. Minor-element distribution in olivine. Journal of Geology
78: 304-325.
Sun S.S. and McDonough W.F., 1989. Chemical and isotopic systematics of oceanic basalts:
implications for mantle composition and processes. In: Saunders AD, Norry MJ (Eds.),
Magmatism in the Ocean Basins. Geological Society Special Publication, pp. 313–345.
Teixeira, A.S., Ferreira Filho, C.F., DellaGiustina, M.E.S., Araújo, S.M., Silva, H.H.A.D.
submitted. Geology, Petrology and Geochronology of the Lago Grande Layered
Complex: Evidence for a PGE-Mineralized Magmatic Suite in The Carajás Province,
Brazil. Submitted to Ore Geology Reviews.

63
Teixeira, A.S., 2013. Geologia, Petrologia e Geocronologia do Complexo Acamadado Lago
Grande: Evidência para uma Suite Magmática Mineralizada a PGE na Província Carajás
– Brasil. Unpbl. M.Sc. thesis, Universidade de Brasília, Brazil, 108 pp.
Trendall, A.F., Basei, M.A.S., De Laeter, J.R. and Nelson, D.R., 1998. SHRIMP zircon U-Pb
constraints on the age of the Carajás Formation, Grão Pará Group, Amazon Craton. J.
South Am. Earth Sci. 11, 265–277.
Vale 1Q14 Report; in www.vale.com.
Vale 2013 Annual Report; in www.vale.com.
Villas, R.N. and Santos, M.D., 2001. Gold deposits of the Carajás Mineral Province: deposit
types and metallogenesis. Miner. Deposita 36, 300–331.
Wedepohl, K.H., 1995. The composition of the continental crust. Geochimica Cosmochimica
Acta, v. 59, 1217-1232.
Wilson, A.H., 1982. The Geology of the Great ‘Dyke’, Zimbabwe: The Ultramafic Rocks’.
Journl of Petrology, v. 23, p. 240–292.

64
CONCLUSÕES
As principais conclusões alcançadas com este estudo são listadas a seguir:
1. Apesar da proximidade geográfica e similaridade do ambiente tectónico das
duas intrusões, os dois complexos apresentam uma sequencia de cristalização
magmática completamente distinta. O Complexo da Serra da Onça (CSO) é
caracterizado por Ol+Chr > Opx+Chr > Opx > Opx+Pl > Opx+Pl+Cpx, já o
Complexo da Serra do Puma (CSP) por Ol+Chr > Ol+Cpx+Chr > Cpx >
Cpx+Pl .
2. A abundancia de rochas ultramáficas (dunitos e peridotitos), elevado teor de
MgO e o range composicional dos cúmulus de olivina (Fo92) são evidencias de
um magma parental muito primitivo para os dois complexos.
3. A cristalização de Opx antes da formação de Cpx no CSO indica que o magma
parental era saturado em sílica, enquanto que a ausência de Opx como mineral
cúmulus no CSP, sugere um magma primário não saturado em sílica.
4. Os resultados analíticos de rocha total, para elementos maiores, refletem a
abundancia dos minerais cúmulus nos dois complexos, e são consistentes com
a sequência de cristalização distinta para o CSO e CSP.
5. Uma distribuição muito semelhante de elementos incompatíveis e traços,
normatizados ao manto, para as rochas do CSO e CSP sugere que estas rochas
cumuláticas cristalizaram a partir de magmas parentais com conteúdos
similares de elementos incompatíveis.
6. O enriquecimento em ETRL e as anomalias negativas de Nb e Ta,
normatizados ao manto, sugerem uma contaminação por crosta continental do
magma parental primitivo.
7. Os dois complexos apresentam valores negativos de εNd (T = 2.77 Ga), mas
as rochas gabróicas do CSO (εNd (T = 2.77 Ga) = -3.33 to - 2.12) são mais
negativas e menos variáveis do que as do CSP (εNd (T=2.77 Ga) = -2.47 to
2.41).
8. A combinação das diversas evidências sugere que o magma parental dos dois
complexos é derivado de uma fonte similar, seguido de variável contaminação
por crosta continental, que é mais significativa no CSO.
9. A idade de 2713±30 Ma registrada para o SPC neste estudo é mais jovem que
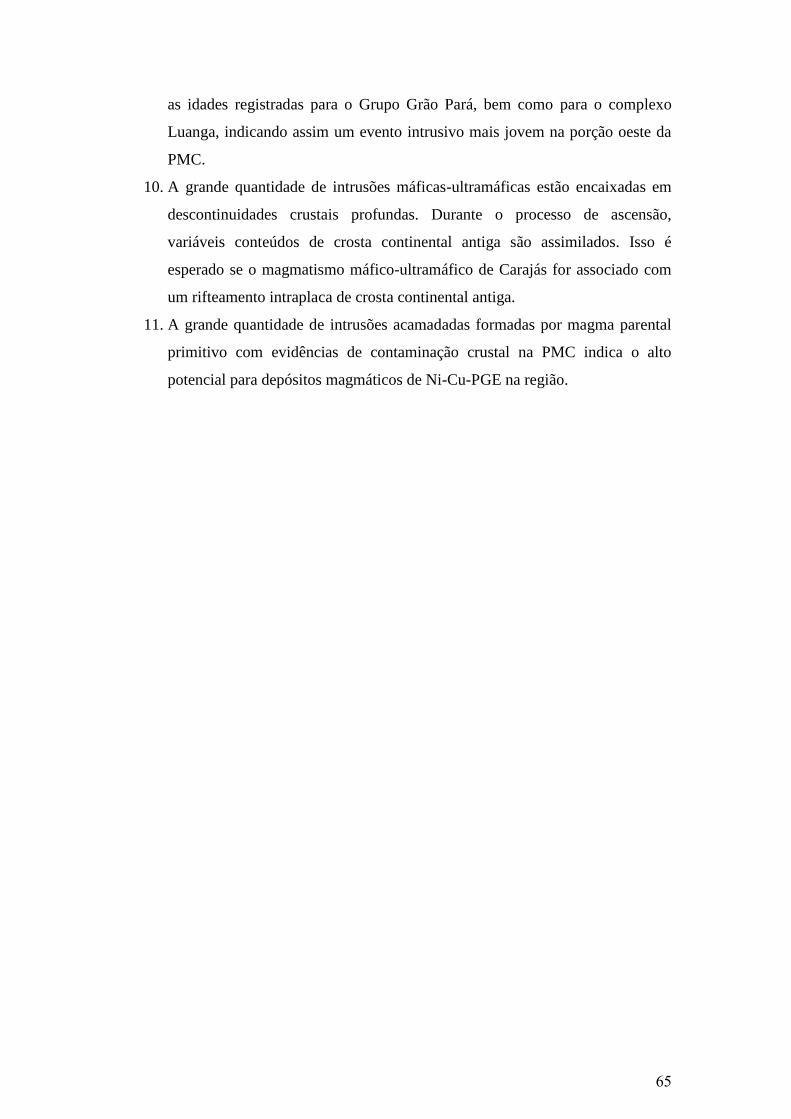
65
as idades registradas para o Grupo Grão Pará, bem como para o complexo
Luanga, indicando assim um evento intrusivo mais jovem na porção oeste da
PMC.
10. A grande quantidade de intrusões máficas-ultramáficas estão encaixadas em
descontinuidades crustais profundas. Durante o processo de ascensão,
variáveis conteúdos de crosta continental antiga são assimilados. Isso é
esperado se o magmatismo máfico-ultramáfico de Carajás for associado com
um rifteamento intraplaca de crosta continental antiga.
11. A grande quantidade de intrusões acamadadas formadas por magma parental
primitivo com evidências de contaminação crustal na PMC indica o alto
potencial para depósitos magmáticos de Ni-Cu-PGE na região.

I
ANEXOS
(Resultados de química mineral – micro sonda – olivina (Ol), ortopiroxênio
(Opx), clinopiroxênio (Cpx) e plagioclásio (Pl) dos Complexos da Serra do Onça
e Serra do Puma).

II
SC06 SC06 SC06 SC06 SC06 SC06 SC08 SC08 SC08 SC08 SC08 SC28 SC28 SC28 SC28 SC28 SC28 SC10A SC10A SC10A SC10A SC10A SC10A SC10A
OL1.1 OL1.2 OL2.1 OL2.2 OL3.1 OL3.2 OL1.1 OL1.2 OL2.1 OL2.2 OL3.1 OL1.1 OL1.2 OL2.1 OL2.2 OL3.1 OL3.2 OL2.1 OL2.2 OL3.1 OL3.2 OL4.1 OL4.2 OL5.1
Location (m) 230.0 230.0 230.0 230.0 230.0 230.0 710.0 710.0 710.0 710.0 710.0 100.5 100.5 100.5 100.5 100.5 100.5 920.0 920.0 920.0 920.0 920.0 920.0 920.0
SiO2 (wt.%) 41.53 42.00 42.24 41.88 41.83 41.82 41.40 41.30 41.22 41.53 41.07 40.76 40.50 42.44 41.83 41.64 41.87 41.96 42.06 41.24 41.20 41.74 42.14 41.79
Al2O3 (wt.%) 0.02 0.02 0.01 0.06 <0.01 0.03 <0.01 0.02 0.03 <0.01 <0.01 0.03 0.01 <0.01 <0.01 <0.01 <0.01 0.03 <0.01 0.03 0.01 0.01 0.03 0.02
MgO (wt.%) 50.09 50.75 51.23 50.01 50.97 50.89 46.74 46.70 46.79 47.36 46.89 50.43 50.34 51.27 51.77 51.42 51.25 51.16 51.16 50.43 50.66 50.86 50.83 50.70
FeO (wt.%) 7.99 8.19 8.05 8.39 8.04 8.20 12.90 13.04 13.11 13.03 12.66 7.42 7.25 7.45 7.53 7.46 7.57 8.07 8.13 8.20 8.00 7.99 8.06 8.03
NiO (wt.%) 0.44 0.45 0.45 0.42 0.42 0.46 0.50 0.49 0.53 0.51 0.51 0.49 0.51 0.50 0.51 0.50 0.50 0.32 0.31 0.32 0.32 0.27 0.33 0.28
Cr2O3 (wt.%) 0.07 <0.01 0.02 0.02 0.02 0.05 0.02 0.04 0.12 0.03 <0.01 0.01 0.04 0.01 <0.01 0.04 0.04 0.02 <0.01 0.01 0.03 0.02 0.06 <0.01
MnO (wt.%) 0.11 0.08 0.09 0.09 0.09 0.09 0.20 0.18 0.17 0.14 0.18 0.06 0.06 0.10 0.09 0.09 0.10 0.06 0.08 0.08 0.06 0.09 0.07 0.06
Total (wt.%) 100.24 101.49 102.09 100.87 101.38 101.52 101.75 101.77 101.97 102.61 101.31 99.19 98.71 101.77 101.73 101.16 101.33 101.61 101.74 100.30 100.27 100.98 101.52 100.88
Si * 1.01 1.01 1.01 1.01 1.00 1.00 1.01 1.01 1.01 1.01 1.01 1.00 1.00 1.01 1.00 1.00 1.00 1.00 1.00 1.00 1.00 1.00 1.01 1.01
Al * 0.00 0.00 0.00 0.00 0.00 0.00 0.00 0.00 0.00 0.00 0.00 0.00 0.00 0.00 0.00 0.00 0.00 0.00 0.00 0.00 0.00 0.00 0.00 0.00
Mg * 1.81 1.81 1.82 1.80 1.82 1.82 1.70 1.70 1.70 1.71 1.71 1.84 1.85 1.82 1.84 1.84 1.83 1.82 1.82 1.82 1.83 1.82 1.81 1.82
Fe * 0.16 0.16 0.16 0.17 0.16 0.16 0.26 0.27 0.27 0.26 0.26 0.15 0.15 0.15 0.15 0.15 0.15 0.16 0.16 0.17 0.16 0.16 0.16 0.16
Ni * 0.01 0.01 0.01 0.01 0.01 0.01 0.01 0.01 0.01 0.01 0.01 0.01 0.01 0.01 0.01 0.01 0.01 0.01 0.01 0.01 0.01 0.01 0.01 0.01
Cr * 0.00 0.00 0.00 0.00 0.00 0.00 0.00 0.00 0.00 0.00 0.00 0.00 0.00 0.00 0.00 0.00 0.00 0.00 0.00 0.00 0.00 0.00 0.00 0.00
Mn * 0.00 0.00 0.00 0.00 0.00 0.00 0.00 0.00 0.00 0.00 0.00 0.00 0.00 0.00 0.00 0.00 0.00 0.00 0.00 0.00 0.00 0.00 0.00 0.00
Total * 2.99 2.99 2.99 2.99 3.00 3.00 2.99 2.99 2.99 2.99 2.99 3.00 3.00 2.99 3.00 3.00 3.00 3.00 3.00 3.00 3.00 3.00 2.99 2.99
Fo % 91.69 91.62 91.81 91.32 91.78 91.63 86.41 86.29 86.26 86.50 86.68 92.32 92.47 92.37 92.37 92.39 92.26 91.81 91.74 91.57 91.81 91.82 91.77 91.78
Fa % 8.20 8.30 8.10 8.59 8.13 8.28 13.38 13.51 13.56 13.35 13.13 7.62 7.47 7.53 7.53 7.53 7.65 8.12 8.18 8.36 8.13 8.09 8.16 8.15
SC33b SC33b SC33b SC33b SC33b SC33b SC34b SC34b SC34b SC34b SC34b SC36 SC36 SC36 SC36 SC36 SC36 SC37 SC37 SC37 SC37 SC37 SC37 SC38
OL1.1 OL1.2 OL1.3 OL2.1 OL2.2 OL3.1 OL1.1 OL1.2 OL2.1 OL2.2 OL3.1 OL1.1 OL1.2 OL2.1 OL2.2 OL3.1 OL3.2 OL1.1 OL1.2 OL2.1 OL2.2 OL3.1 OL3.2 OL1.1
Location (m) 2391.0 2391.0 2391.0 2391.0 2391.0 2391.0 2254.0 2254.0 2254.0 2254.0 2254.0 2130.0 2130.0 2130.0 2130.0 2130.0 2130.0 2073.0 2073.0 2073.0 2073.0 2073.0 2073.0 2029.0
SiO2 (wt.%) 39.00 38.86 39.35 40.19 40.83 40.74 39.62 39.34 38.96 39.01 39.31 39.95 39.83 39.85 40.28 39.95 40.22 38.97 39.08 39.69 39.75 39.52 39.38 39.99
Al2O3 (wt.%) 0.01 0.01 <0.01 0.04 <0.01 0.01 <0.01 0.01 <0.01 <0.01 <0.01 0.01 0.04 0.04 0.02 <0.01 0.01 <0.01 0.01 <0.01 0.01 0.01 0.01 0.01
MgO (wt.%) 44.24 44.38 44.47 44.42 44.58 44.86 39.79 39.59 39.71 39.85 39.63 41.70 40.70 42.40 42.37 41.89 41.92 40.86 40.28 41.06 40.87 40.84 40.47 41.25
FeO (wt.%) 15.57 15.78 15.37 16.49 15.78 15.30 21.81 21.16 21.71 21.37 21.52 19.32 19.88 18.65 18.47 18.94 19.26 19.98 20.00 19.97 19.60 19.62 19.85 19.36
NiO (wt.%) 0.38 0.35 0.33 0.37 0.33 0.33 0.27 0.23 0.26 0.22 0.25 0.23 0.22 0.25 0.24 0.25 0.23 0.23 0.24 0.24 0.20 0.24 0.20 0.26
Cr2O3 (wt.%) <0.01 0.02 0.03 0.02 0.03 <0.01 0.02 <0.01 0.02 0.02 0.01 0.01 0.02 <0.01 <0.01 <0.01 0.02 <0.01 <0.01 <0.01 0.01 <0.01 0.01 <0.01
MnO (wt.%) 0.20 0.21 0.18 0.19 0.19 0.20 0.28 0.28 0.28 0.28 0.30 0.27 0.25 0.27 0.28 0.27 0.22 0.25 0.31 0.29 0.26 0.26 0.28 0.26
Total (wt.%) 99.38 99.60 99.73 101.71 101.73 101.45 101.77 100.61 100.93 100.75 101.01 101.50 100.95 101.46 101.66 101.31 101.87 100.30 99.93 101.25 100.69 100.48 100.19 101.14
Si * 0.99 0.99 0.99 1.00 1.01 1.01 1.01 1.01 1.00 1.00 1.01 1.01 1.01 1.00 1.01 1.01 1.01 1.00 1.01 1.01 1.01 1.01 1.01 1.01
Al * 0.00 0.00 0.00 0.00 0.00 0.00 0.00 0.00 0.00 0.00 0.00 0.00 0.00 0.00 0.00 0.00 0.00 0.00 0.00 0.00 0.00 0.00 0.00 0.00
Mg * 1.68 1.68 1.68 1.65 1.64 1.66 1.51 1.52 1.52 1.53 1.51 1.57 1.54 1.59 1.58 1.58 1.57 1.56 1.55 1.55 1.55 1.55 1.55 1.56
Fe * 0.33 0.34 0.33 0.34 0.33 0.32 0.46 0.45 0.47 0.46 0.46 0.41 0.42 0.39 0.39 0.40 0.40 0.43 0.43 0.42 0.42 0.42 0.43 0.41
Ni * 0.01 0.01 0.01 0.01 0.01 0.01 0.01 0.01 0.01 0.00 0.01 0.01 0.01 0.01 0.01 0.01 0.01 0.01 0.01 0.01 0.00 0.01 0.00 0.01
Cr * 0.00 0.00 0.00 0.00 0.00 0.00 0.00 0.00 0.00 0.00 0.00 0.00 0.00 0.00 0.00 0.00 0.00 0.00 0.00 0.00 0.00 0.00 0.00 0.00
Mn * 0.00 0.00 0.00 0.00 0.00 0.00 0.01 0.01 0.01 0.01 0.01 0.01 0.01 0.01 0.01 0.01 0.01 0.01 0.01 0.01 0.01 0.01 0.01 0.01
Total * 3.01 3.01 3.01 3.00 2.99 2.99 2.99 2.99 3.00 3.00 2.99 2.99 2.99 3.00 2.99 2.99 2.99 3.00 2.99 2.99 2.99 2.99 2.99 2.99
Fo % 83.34 83.18 83.59 82.60 83.27 83.76 76.25 76.69 76.30 76.63 76.40 79.14 78.28 79.97 80.11 79.53 79.32 78.26 77.94 78.32 78.57 78.55 78.19 78.93
Fa % 16.45 16.60 16.21 17.20 16.53 16.03 23.45 23.00 23.40 23.06 23.28 20.57 21.45 19.74 19.60 20.18 20.45 21.47 21.71 21.37 21.14 21.17 21.51 20.79
SC38 SC38 SC38 SC38 SC39 SC39 SC39 SC39 SC39 SC40A SC40A SC40A SC40A SC40A SC40A SC41 SC41 SC41 SC41 SC41 SC41 SC48 SC48 SC48
OL1.2 OL2.1 OL2.2 OL3.1 OL1.1 OL1.2 OL2.1 OL3.1 OL4.1 OL1.1 OL1.2 OL2.1 OL2.2 OL3.1 OL3.2 OL1.1 OL1.2 OL2.1 OL2.2 OL3.1 OL3.2 OL1.1 OL1.2 OL2.1
Location (m) 2029.0 2029.0 2029.0 2029.0 1998.0 1998.0 1998.0 1998.0 1998.0 1930.0 1930.0 1930.0 1930.0 1930.0 1930.0 1850.0 1850.0 1850.0 1850.0 1850.0 1850.0 1145.0 1145.0 1145.0
SiO2 (wt.%) 39.93 40.04 39.78 40.14 39.95 39.77 39.98 39.98 39.97 39.64 40.01 39.80 39.73 39.73 39.35 39.68 39.56 39.86 39.74 39.72 39.67 40.44 40.68 40.95
Al2O3 (wt.%) <0.01 0.01 0.01 0.02 0.01 0.01 0.01 0.02 <0.01 <0.01 <0.01 <0.01 <0.01 <0.01 0.04 0.02 0.02 0.01 0.01 0.01 0.01 0.03 0.02 0.01
MgO (wt.%) 41.52 42.49 41.90 41.80 41.17 41.35 41.35 41.74 41.36 41.26 41.92 41.96 41.68 41.69 41.33 41.89 41.76 41.81 41.54 41.88 42.05 45.21 45.26 45.49
FeO (wt.%) 19.31 17.96 18.71 19.25 19.76 19.51 19.40 19.86 19.45 18.81 18.58 18.82 18.82 18.77 18.84 18.78 18.97 18.51 18.87 18.61 18.67 14.38 14.03 14.40
NiO (wt.%) 0.19 0.25 0.23 0.23 0.21 0.23 0.26 0.22 0.21 0.23 0.24 0.24 0.26 0.23 0.23 0.24 0.22 0.24 0.23 0.24 0.22 0.38 0.36 0.39
Cr2O3 (wt.%) 0.03 0.01 <0.01 0.02 <0.01 0.01 0.03 <0.01 <0.01 0.04 <0.01 <0.01 0.01 <0.01 0.02 0.03 0.01 <0.01 <0.01 0.02 0.03 0.02 <0.01 0.02
MnO (wt.%) 0.27 0.28 0.25 0.28 0.28 0.24 0.26 0.26 0.26 0.25 0.23 0.20 0.22 0.25 0.22 0.26 0.24 0.25 0.24 0.25 0.25 0.16 0.14 0.21
Total (wt.%) 101.25 101.05 100.88 101.74 101.38 101.10 101.28 102.06 101.25 100.22 100.98 101.02 100.72 100.67 100.03 100.90 100.78 100.68 100.65 100.73 100.89 100.62 100.49 101.45
Si * 1.01 1.01 1.01 1.01 1.01 1.01 1.01 1.01 1.01 1.01 1.01 1.01 1.01 1.01 1.01 1.01 1.00 1.01 1.01 1.01 1.00 1.01 1.01 1.01
Al * 0.00 0.00 0.00 0.00 0.00 0.00 0.00 0.00 0.00 0.00 0.00 0.00 0.00 0.00 0.00 0.00 0.00 0.00 0.00 0.00 0.00 0.00 0.00 0.00
Mg * 1.56 1.59 1.58 1.57 1.55 1.56 1.56 1.56 1.56 1.57 1.58 1.58 1.58 1.58 1.57 1.58 1.58 1.58 1.57 1.58 1.59 1.68 1.68 1.67
Fe * 0.41 0.38 0.40 0.41 0.42 0.41 0.41 0.42 0.41 0.40 0.39 0.40 0.40 0.40 0.40 0.40 0.40 0.39 0.40 0.39 0.40 0.30 0.29 0.30
Ni * 0.00 0.01 0.01 0.01 0.00 0.01 0.01 0.00 0.00 0.01 0.01 0.01 0.01 0.01 0.01 0.01 0.01 0.01 0.01 0.01 0.00 0.01 0.01 0.01
Cr * 0.00 0.00 0.00 0.00 0.00 0.00 0.00 0.00 0.00 0.00 0.00 0.00 0.00 0.00 0.00 0.00 0.00 0.00 0.00 0.00 0.00 0.00 0.00 0.00
Mn * 0.01 0.01 0.01 0.01 0.01 0.01 0.01 0.01 0.01 0.01 0.01 0.00 0.01 0.01 0.01 0.01 0.01 0.01 0.01 0.01 0.01 0.00 0.00 0.00
Total * 2.99 2.99 2.99 2.99 2.99 2.99 2.99 2.99 2.99 2.99 2.99 2.99 2.99 2.99 2.99 3.00 3.00 2.99 2.99 2.99 2.99 2.99 2.99 2.99
Fo % 79.08 80.59 79.75 79.23 78.55 78.87 78.94 78.71 78.90 79.41 79.89 79.72 79.59 79.62 79.44 79.68 79.49 79.89 79.48 79.83 79.84 84.71 85.06 84.74
Fa % 20.63 19.11 19.98 20.47 21.15 20.88 20.78 21.01 20.82 20.31 19.87 20.06 20.17 20.12 20.32 20.05 20.25 19.84 20.26 19.90 19.89 15.12 14.79 15.05
SC48 SC48 SC48 SC50 SC50 SC50 SC50 SC50 SC50 SC45 SC45 SC45 SC45 SC45 SC46 SC46 SC46 SC46 SC46 SC46 SC46 SC46
OL2.2 OL3.1 OL3.2 OL1.1 OL1.2 OL2.1 OL2.2 OL3.1 OL3.2 OLIV1.1 OLIV1.2 OLIV1.3 OLIV2.1 OLIV2.2 OL1.1 OL1.2 OL1.3 OL2.1 OL2.2 OL3.1 OL3.2 OL3.3
Location (m) 1145 1145 1145 790 790 790 790 790 790 1473 1473 1473 1473 1473 1213 1213 1213 1213 1213 1213 1213 1213
SiO2 (wt.%) 40.97 40.70 40.86 41.25 41.42 41.40 41.33 41.31 41.68 39.82 39.79 39.87 39.67 39.57 39.85 39.19 39.65 36.18 38.25 40.12 40.18 40.14
Al2O3 (wt.%) <0.01 0.02 0.01 <0.01 0.05 0.01 0.01 0.01 0.02 0.01 0.01 <0.01 <0.01 <0.01 0.01 <0.01 0.01 <0.01 <0.01 <0.01 0.01 <0.01
MgO (wt.%) 45.29 44.85 45.37 47.82 47.40 48.20 47.72 48.00 47.77 41.31 41.39 41.48 41.26 41.52 41.05 40.36 40.96 40.27 41.90 42.15 42.19 42.49
FeO (wt.%) 14.28 14.57 14.68 11.03 11.65 10.90 10.91 11.01 11.13 19.13 19.16 18.86 18.96 18.76 19.34 20.31 20.10 13.38 14.92 18.10 17.89 17.58
NiO (wt.%) 0.37 0.36 0.38 0.41 0.39 0.40 0.36 0.40 0.39 0.30 0.33 0.32 0.35 0.32 0.34 0.33 0.32 0.20 0.25 0.30 0.36 0.29
Cr2O3 (wt.%) 0.01 0.01 0.01 <0.01 0.09 0.01 <0.01 <0.01 0.01 <0.01 <0.01 <0.01 0.01 <0.01 <0.01 0.01 <0.01 0.01 0.02 <0.01 <0.01 0.02
MnO (wt.%) 0.16 0.16 0.18 0.14 0.16 0.19 0.17 0.18 0.18 0.25 0.22 0.20 0.23 0.23 0.20 0.27 0.21 0.13 0.16 0.21 0.22 0.22
Total (wt.%) 101.07 100.66 101.48 100.64 101.16 101.12 100.49 100.90 101.18 100.82 100.90 100.72 100.47 100.39 100.78 100.47 101.24 90.17 95.49 100.88 100.84 100.73
Si * 1.01 1.01 1.01 1.01 1.01 1.01 1.01 1.01 1.01 1.01 1.01 1.01 1.01 1.01 1.01 1.01 1.01 1.01 1.01 1.01 1.01 1.01
Al * 0.00 0.00 0.00 0.00 0.00 0.00 0.00 0.00 0.00 0.00 0.00 0.00 0.00 0.00 0.00 0.00 0.00 0.00 0.00 0.00 0.00 0.00
Mg * 1.67 1.66 1.67 1.74 1.73 1.75 1.74 1.75 1.73 1.56 1.56 1.57 1.57 1.58 1.55 1.54 1.55 1.67 1.65 1.58 1.59 1.60
Fe * 0.30 0.30 0.30 0.23 0.24 0.22 0.22 0.23 0.23 0.41 0.41 0.40 0.40 0.40 0.41 0.44 0.43 0.31 0.33 0.38 0.38 0.37
Ni * 0.01 0.01 0.01 0.01 0.01 0.01 0.01 0.01 0.01 0.01 0.01 0.01 0.01 0.01 0.01 0.01 0.01 0.00 0.01 0.01 0.01 0.01
Cr * 0.00 0.00 0.00 0.00 0.00 0.00 0.00 0.00 0.00 0.00 0.00 0.00 0.00 0.00 0.00 0.00 0.00 0.00 0.00 0.00 0.00 0.00
Mn * 0.00 0.00 0.00 0.00 0.00 0.00 0.00 0.00 0.00 0.01 0.01 0.00 0.01 0.01 0.00 0.01 0.00 0.00 0.00 0.00 0.01 0.01
Total * 2.99 2.99 2.99 2.99 2.99 2.99 2.99 2.99 2.99 2.99 2.99 2.99 2.99 2.99 2.99 3.00 2.99 2.99 2.99 2.99 2.99 2.99
Fo % 84.83 84.44 84.48 88.42 87.74 88.57 88.48 88.44 88.27 79.16 79.19 79.51 79.31 79.58 78.92 77.75 78.24 84.16 83.20 80.40 80.59 80.96
Fa % 15.01 15.39 15.33 11.44 12.10 11.24 11.35 11.38 11.54 20.57 20.57 20.28 20.44 20.17 20.86 21.95 21.54 15.69 16.62 19.38 19.17 18.79
Sample
Analysis
Sample
Analysis
SE
RR
A D
O P
UM
A C
OM
PLE
XS
ER
RA
DO
PU
MA
CO
MP
LE
X
Sample
Analysis
Sample
Analysis
SE
RR
A D
O O
NÇ
A C
OM
PLE
XS
ER
RA
DO
PU
MA
CO
MP
LE
X

III
SC22 SC22 SC22 SC22 SC22 SC22 SC22 SC22 SC22 SC23 SC23 SC23 SC23 SC23 SC24A SC24A SC24A SC24A SC24A SC11 SC11 SC11 SC11 SC11
OPX1.1 OPX1.2 OPX1.3 OPX2.1 OPX2.2 OPX%.1 CPX3.1 OPX4.1 OPX6.1 OPX1.1 OPX1.2 OPX1.3 OPX2.1 OPX2.2 OPX1.1 OPX2.1 OPX2.2 OPX3.1 OPX4.1 OPX1.1 OPX1.2 OPX2.1 OPX2.2 OPX3.1
Location (m) 1898.0 1898.0 1898.0 1898.0 1898.0 1898.0 1898.0 1898.0 1898.0 1987.0 1987.0 1987.0 1987.0 1987.0 2081.0 2081.0 2081.0 2081.0 2081.0 1060.0 1060.0 1060.0 1060.0 1060.0
Na2O wt. % 0.04 0.05 0.04 0.01 <0.01 0.03 <0.01 <0.01 0.01 0.03 <0.01 <0.01 <0.01 <0.01 <0.01 0.01 <0.01 0.01 <0.01 <0.01 0.01 0.02 0.01 0.01
K2O wt. % 0.01 0.01 0.02 <0.01 0.01 0.01 <0.01 0.03 <0.01 <0.01 0.01 <0.01 0.03 <0.01 0.01 0.02 <0.01 0.01 0.02 <0.01 <0.01 <0.01 <0.01 <0.01
Al2O3 wt. % 1.32 1.36 1.37 1.11 1.12 1.32 0.98 1.10 1.12 0.86 0.89 1.09 0.95 0.91 1.14 1.23 1.22 1.22 1.14 1.12 1.06 1.05 1.08 1.07
MgO wt. % 24.95 24.24 24.63 24.76 24.95 24.37 25.02 25.10 24.50 20.97 21.30 21.41 21.66 21.76 22.61 22.85 22.57 22.31 22.47 27.17 27.31 27.06 27.59 27.19
SiO2 wt. % 53.22 53.36 53.35 53.17 53.19 52.73 52.98 52.94 52.92 51.48 51.53 52.04 52.24 52.49 52.22 52.36 52.36 52.60 51.85 54.22 54.09 54.20 54.14 54.56
CaO wt. % 3.07 3.21 2.03 1.24 0.97 2.66 1.12 1.36 1.73 5.46 1.01 1.04 1.20 1.62 1.68 1.94 1.96 1.91 1.05 2.34 1.97 2.51 2.04 2.53
MnO wt. % 0.32 0.29 0.32 0.27 0.34 0.32 0.33 0.29 0.27 0.44 0.41 0.45 0.43 0.45 0.38 0.33 0.41 0.34 0.40 0.23 0.28 0.25 0.24 0.25
TiO2 wt. % 0.16 0.15 0.16 0.22 0.21 0.19 0.21 0.22 0.24 0.19 0.20 0.20 0.19 0.16 0.20 0.23 0.24 0.24 0.22 0.10 0.09 0.10 0.10 0.08
FeO wt. % 14.802 16.011 16.825 17.321 17.476 15.847 17.085 16.594 17.263 16.747 22.073 22.443 21.951 21.557 19.703 19.116 19.623 19.885 20.308 13.032 13.113 12.992 12.681 13.055
NiO wt. % 0.05 0.06 0.06 0.05 0.05 0.05 0.07 0.05 0.05 0.02 0.03 0.01 0.02 0.04 0.06 0.07 0.04 0.06 0.06 0.13 0.12 0.12 0.10 0.12
Cr2O3 wt. % 0.24 0.27 0.25 0.19 0.20 0.22 0.23 0.23 0.21 <0.01 <0.01 <0.01 <0.01 0.02 0.17 0.16 0.17 0.17 0.16 0.05 0.03 0.03 0.06 0.06
Fe2O3 wt. % 1.60 0.28 0.10 <0.01 <0.01 0.88 0.51 0.74 0.37 3.08 0.20 0.11 0.82 0.82 0.15 0.52 0.37 <0.01 0.20 <0.01 0.25 0.05 0.52 <0.01
Total wt. % 99.78 99.30 99.14 98.34 98.51 98.63 98.54 98.65 98.67 99.27 97.65 98.80 99.50 99.82 98.32 98.82 98.97 98.74 97.88 98.39 98.32 98.38 98.56 98.92
Na * <0.01 <0.01 <0.01 <0.01 <0.01 <0.01 <0.01 <0.01 <0.01 <0.01 <0.01 <0.01 <0.01 <0.01 <0.01 <0.01 <0.01 <0.01 <0.01 <0.01 <0.01 <0.01 <0.01 <0.01
K * <0.01 <0.01 <0.01 <0.01 <0.01 <0.01 <0.01 <0.01 <0.01 <0.01 <0.01 <0.01 <0.01 <0.01 <0.01 <0.01 <0.01 <0.01 <0.01 <0.01 <0.01 <0.01 <0.01 <0.01
Al * 0.06 0.06 0.06 0.05 0.05 0.06 0.04 0.05 0.05 0.04 0.04 0.05 0.04 0.04 0.05 0.05 0.05 0.05 0.05 0.05 0.05 0.05 0.05 0.05
Mg * 1.36 1.33 1.35 1.37 1.38 1.35 1.38 1.38 1.35 1.17 1.22 1.21 1.21 1.21 1.27 1.27 1.26 1.25 1.27 1.47 1.48 1.47 1.49 1.47
Si * 1.94 1.96 1.96 1.97 1.97 1.95 1.96 1.96 1.96 1.93 1.97 1.97 1.96 1.96 1.96 1.96 1.96 1.97 1.96 1.97 1.97 1.97 1.97 1.98
Ca * 0.12 0.13 0.08 0.05 0.04 0.11 0.05 0.05 0.07 0.22 0.04 0.04 0.05 0.07 0.07 0.08 0.08 0.08 0.04 0.09 0.08 0.10 0.08 0.10
Mn * 0.01 0.01 0.01 0.01 0.01 0.01 0.01 0.01 0.01 0.01 0.01 0.01 0.01 0.01 0.01 0.01 0.01 0.01 0.01 0.01 0.01 0.01 0.01 0.01
Ti * <0.01 <0.01 <0.01 0.01 0.01 0.01 0.01 0.01 0.01 0.01 0.01 0.01 0.01 <0.01 0.01 0.01 0.01 0.01 0.01 <0.01 <0.01 <0.01 <0.01 <0.01
Fe * 0.45 0.49 0.52 0.54 0.54 0.49 0.53 0.51 0.54 0.53 0.71 0.71 0.69 0.67 0.62 0.60 0.61 0.62 0.64 0.40 0.40 0.40 0.39 0.40
Ni * <0.01 <0.01 <0.01 <0.01 <0.01 <0.01 <0.01 <0.01 <0.01 <0.01 <0.01 <0.01 <0.01 <0.01 <0.01 <0.01 <0.01 <0.01 <0.01 <0.01 <0.01 <0.01 <0.01 <0.01
Cr * 0.01 0.01 0.01 0.01 0.01 0.01 0.01 0.01 0.01 <0.01 <0.01 <0.01 <0.01 <0.01 0.01 0.01 0.01 0.01 0.01 <0.01 <0.01 <0.01 <0.01 <0.01
Fe3+ * 0.04 0.01 <0.01 <0.01 <0.01 0.03 0.01 0.02 0.01 0.09 0.01 <0.01 0.02 0.02 <0.01 0.02 0.01 <0.01 0.01 <0.01 0.01 <0.01 0.01 <0.01
Total * 4.00 4.00 4.00 4.00 4.00 4.00 4.00 4.00 4.00 4.00 4.00 4.00 4.00 4.00 4.00 4.00 4.00 4.00 4.00 4.00 4.00 4.00 4.00 4.00
WO % 6.19 6.47 4.08 2.52 1.96 5.41 2.27 2.76 3.49 11.36 2.10 2.14 2.46 3.30 3.45 3.97 4.01 3.91 2.16 4.64 3.91 4.97 4.04 4.99
EN % 70.00 67.91 68.98 69.69 69.99 68.93 70.28 70.60 68.86 60.72 61.49 61.17 61.74 61.69 64.44 64.99 64.08 63.69 64.49 74.86 75.35 74.55 75.98 74.54
FS % 23.81 25.62 26.94 27.79 28.05 25.66 27.45 26.65 27.65 27.93 36.42 36.69 35.80 35.01 32.12 31.05 31.91 32.40 33.35 20.50 20.74 20.48 19.98 20.47
SC11 SC12 SC12 SC12 SC12 SC12 SC12 SC13 SC13 SC13 SC13 SC13 SC14 SC14 SC14 SC14 SC14 SC14 SC15 SC15 SC15 SC15 SC15 SC15
OPX3.2 OPX1.1 OPX1.2 OPX1.3 OPX2.1 OPX2.2 OPX2.3 OPX1.1 OPX1.2 OPX1.3 OPX2.1 OPX2.2 OPX1.1 OPX1.2 OPX1.3 OPX2.1 OPX2.2 OPX2.3 OPX1.1 OPX1.2 OPX1.3 OPX2.1 OPX2.2 OPX3.1
Location (m) 1060.0 1120.0 1120.0 1120.0 1120.0 1120.0 1120.0 1135.0 1135.0 1135.0 1135.0 1135.0 1225.0 1225.0 1225.0 1225.0 1225.0 1225.0 1370.0 1370.0 1370.0 1370.0 1370.0 1370.0
Na2O wt. % <0.01 <0.01 0.02 0.01 <0.01 <0.01 <0.01 <0.01 <0.01 <0.01 <0.01 <0.01 <0.01 <0.01 <0.01 <0.01 <0.01 <0.01 <0.01 <0.01 <0.01 <0.01 <0.01 0.01
K2O wt. % <0.01 <0.01 <0.01 <0.01 0.02 <0.01 <0.01 <0.01 <0.01 0.01 <0.01 <0.01 0.01 0.01 0.01 <0.01 <0.01 <0.01 <0.01 <0.01 <0.01 <0.01 0.01 0.01
Al2O3 wt. % 1.00 0.91 0.94 0.91 0.85 0.96 0.94 1.13 1.04 1.02 0.97 0.92 0.92 0.95 1.01 0.90 0.88 0.89 0.93 0.91 0.89 0.87 0.80 0.97
MgO wt. % 27.19 25.70 24.69 25.00 25.40 25.68 25.78 25.69 25.40 25.50 25.64 25.71 24.77 25.01 24.74 23.21 23.41 23.45 23.47 23.31 23.57 23.48 23.43 23.45
SiO2 wt. % 53.87 53.63 53.61 53.46 53.42 53.94 54.06 54.05 54.09 53.96 54.30 54.42 53.08 53.27 53.06 53.55 53.23 53.62 53.04 52.63 52.72 52.97 52.97 53.16
CaO wt. % 2.05 0.79 3.01 3.01 1.34 1.99 1.49 0.97 2.09 1.42 1.33 1.29 1.12 1.27 1.10 0.98 2.22 1.06 1.31 1.22 1.07 1.43 1.41 2.28
MnO wt. % 0.23 0.25 0.31 0.26 0.31 0.32 0.31 0.29 0.35 0.31 0.31 0.32 0.31 0.29 0.28 0.33 0.35 0.35 0.35 0.37 0.43 0.36 0.39 0.40
TiO2 wt. % 0.12 0.13 0.12 0.11 0.14 0.11 0.12 0.16 0.17 0.13 0.14 0.12 0.21 0.22 0.20 0.13 0.13 0.13 0.19 0.21 0.21 0.20 0.21 0.20
FeO wt. % 13.067 16.722 15.754 15.196 16.557 15.871 16.516 17.418 16.474 16.994 17.299 17.323 17.703 17.318 17.794 19.447 18.748 19.425 19.7 19.585 19.393 19.41 19.518 18.555
NiO wt. % 0.11 0.08 0.06 0.08 0.07 0.08 0.06 0.03 0.06 0.04 0.04 0.05 0.05 0.05 0.03 0.07 0.03 0.03 0.03 0.05 0.03 0.05 0.03 0.04
Cr2O3 wt. % 0.02 <0.01 0.01 0.04 0.03 0.03 0.04 0.02 0.04 0.04 0.04 0.06 0.03 0.05 0.02 0.03 0.03 0.05 0.03 0.02 0.01 0.02 0.01 0.06
Fe2O3 wt. % 0.24 <0.01 <0.01 0.67 <0.01 1.05 0.53 0.51 0.81 0.76 0.45 0.47 1.07 1.12 0.69 <0.01 <0.01 <0.01 1.08 0.85 1.46 1.08 1.16 1.15
Total wt. % 97.91 98.21 98.52 98.76 98.12 100.03 99.83 100.27 100.52 100.18 100.51 100.68 99.27 99.55 98.93 98.64 99.02 99.00 100.14 99.14 99.78 99.86 99.94 100.26
Na * <0.01 <0.01 <0.01 <0.01 <0.01 <0.01 <0.01 <0.01 <0.01 <0.01 <0.01 <0.01 <0.01 <0.01 <0.01 <0.01 <0.01 <0.01 <0.01 <0.01 <0.01 <0.01 <0.01 <0.01
K * <0.01 <0.01 <0.01 <0.01 <0.01 <0.01 <0.01 <0.01 <0.01 <0.01 <0.01 <0.01 <0.01 <0.01 <0.01 <0.01 <0.01 <0.01 <0.01 <0.01 <0.01 <0.01 <0.01 <0.01
Al * 0.04 0.04 0.04 0.04 0.04 0.04 0.04 0.05 0.04 0.04 0.04 0.04 0.04 0.04 0.04 0.04 0.04 0.04 0.04 0.04 0.04 0.04 0.04 0.04
Mg * 1.48 1.42 1.36 1.37 1.40 1.39 1.40 1.39 1.37 1.38 1.39 1.39 1.36 1.37 1.36 1.29 1.30 1.30 1.29 1.30 1.30 1.30 1.29 1.29
Si * 1.97 1.98 1.98 1.97 1.98 1.96 1.97 1.96 1.96 1.96 1.97 1.97 1.96 1.96 1.96 1.99 1.98 1.99 1.96 1.96 1.95 1.96 1.96 1.96
Ca * 0.08 0.03 0.12 0.12 0.05 0.08 0.06 0.04 0.08 0.06 0.05 0.05 0.04 0.05 0.04 0.04 0.09 0.04 0.05 0.05 0.04 0.06 0.06 0.09
Mn * 0.01 0.01 0.01 0.01 0.01 0.01 0.01 0.01 0.01 0.01 0.01 0.01 0.01 0.01 0.01 0.01 0.01 0.01 0.01 0.01 0.01 0.01 0.01 0.01
Ti * <0.01 <0.01 <0.01 <0.01 <0.01 <0.01 <0.01 <0.01 0.01 <0.01 <0.01 <0.01 0.01 0.01 0.01 <0.01 <0.01 <0.01 0.01 0.01 0.01 0.01 0.01 0.01
Fe * 0.40 0.52 0.49 0.47 0.51 0.48 0.50 0.53 0.50 0.52 0.53 0.52 0.55 0.53 0.55 0.61 0.58 0.60 0.61 0.61 0.60 0.60 0.60 0.57
Ni * <0.01 <0.01 <0.01 <0.01 <0.01 <0.01 <0.01 <0.01 <0.01 <0.01 <0.01 <0.01 <0.01 <0.01 <0.01 <0.01 <0.01 <0.01 <0.01 <0.01 <0.01 <0.01 <0.01 <0.01
Cr * <0.01 <0.01 <0.01 <0.01 <0.01 <0.01 <0.01 <0.01 <0.01 <0.01 <0.01 <0.01 <0.01 <0.01 <0.01 <0.01 <0.01 <0.01 <0.01 <0.01 <0.01 <0.01 <0.01 <0.01
Fe3+ * 0.01 <0.01 <0.01 0.02 <0.01 0.03 0.01 0.01 0.02 0.02 0.01 0.01 0.03 0.03 0.02 <0.01 <0.01 <0.01 0.03 0.02 0.04 0.03 0.03 0.03
Total * 4.00 4.00 4.00 4.00 4.00 4.00 4.00 4.00 4.00 4.00 4.00 4.00 4.00 4.00 4.00 3.98 4.00 3.99 4.00 4.00 4.00 4.00 4.00 4.00
WO % 4.08 1.59 6.02 6.05 2.68 3.95 2.95 1.92 4.14 2.81 2.62 2.54 2.25 2.56 2.22 2.02 4.48 2.15 2.65 2.48 2.16 2.89 2.85 4.59
EN % 75.26 71.80 68.84 69.75 70.91 70.94 71.02 70.73 69.89 70.38 70.29 70.37 69.43 69.85 69.36 66.28 65.52 66.41 65.81 65.87 66.47 65.95 65.78 65.63
FS % 20.66 26.61 25.14 24.20 26.42 25.11 26.03 27.35 25.97 26.80 27.09 27.09 28.32 27.60 28.43 31.70 30.01 31.44 31.55 31.65 31.37 31.17 31.37 29.77
SC16B SC16B SC16B SC16B SC16B SC17 SC17 SC17 SC17 SC17 SC17 SC17 SC17 SC18 SC18 SC18 SC18 SC18 SC18 SC19 SC19 SC19 SC19 SC19
OPX1.1 OPX1.2 OPX2.1 OPX2.2 OPX3.1 OPX1.1 OPX1.2 OPX2.2 OPX2.30PX2.3-REPET CPX3.2 OPX3.1 OPX3.2 OPX1.1 OPX1.2 CPX1.3 OPX2.1 OPX2.2 0PX??? OPX1.1 OPX1.2 OPX2.1 OPX2.2 OPX3.1
Location (m) 1445.0 1445.0 1445.0 1445.0 1445.0 1500.0 1500.0 1500.0 1500.0 1500.0 1500.0 1500.0 1500.0 1565.0 1565.0 1565.0 1565.0 1565.0 1565.0 1670.0 1670.0 1670.0 1670.0 1670.0
Na2O wt. % <0.01 <0.01 <0.01 <0.01 <0.01 <0.01 <0.01 0.01 <0.01 0.01 0.01 0.02 0.01 <0.01 <0.01 <0.01 <0.01 0.02 0.01 <0.01 <0.01 <0.01 <0.01 <0.01
K2O wt. % <0.01 0.01 0.01 <0.01 0.01 <0.01 0.02 0.01 <0.01 <0.01 0.01 <0.01 <0.01 0.01 <0.01 0.01 0.01 0.01 0.01 <0.01 <0.01 0.01 <0.01 0.01
Al2O3 wt. % 0.82 0.83 0.72 0.84 0.79 1.06 1.27 1.26 1.31 1.48 1.08 1.07 1.16 1.28 1.32 1.27 1.27 1.01 1.16 0.97 0.81 0.76 0.97 1.12
MgO wt. % 21.73 21.72 22.00 22.04 21.93 21.74 22.59 21.68 21.59 20.28 18.62 20.68 20.35 22.60 22.29 22.18 21.52 22.63 21.32 23.65 23.75 23.59 23.20 22.32
SiO2 wt. % 52.28 52.23 52.44 52.62 52.42 52.14 52.25 51.67 51.61 52.66 51.50 52.51 52.46 53.15 53.31 52.86 52.37 53.41 52.31 53.44 53.45 53.39 53.36 53.29
CaO wt. % 1.38 1.30 0.74 0.91 1.01 0.88 1.04 1.14 1.37 1.80 0.98 2.77 3.63 0.66 2.77 0.72 3.12 3.27 1.77 0.80 0.79 0.77 1.44 0.97
MnO wt. % 0.44 0.45 0.42 0.48 0.43 0.45 0.44 0.45 0.41 0.35 0.49 0.37 0.39 0.35 0.37 0.40 0.34 0.38 0.35 0.45 0.41 0.46 0.46 0.43
TiO2 wt. % 0.19 0.20 0.16 0.18 0.17 0.14 0.14 0.14 0.12 0.17 0.14 0.16 0.13 0.12 0.12 0.13 0.13 0.14 0.18 0.18 0.16 0.17 0.18 0.19
FeO wt. % 21.718 21.735 22.21 22.12 21.954 22.119 20.497 21.278 21.163 22.274 25.279 21.706 20.981 21.791 19.866 22.283 19.977 18.959 21.423 20.385 20.225 20.426 20.28 21.099
NiO wt. % 0.02 0.05 0.02 0.03 0.04 0.02 <0.01 <0.01 <0.01 0.02 0.02 <0.01 <0.01 0.01 0.02 <0.01 0.01 <0.01 0.01 0.04 0.06 0.05 0.04 0.02
Cr2O3 wt. % 0.03 0.01 0.04 0.04 0.02 <0.01 0.01 <0.01 0.02 0.02 0.01 <0.01 <0.01 <0.01 0.01 0.01 <0.01 <0.01 0.01 0.03 0.03 0.03 0.03 0.02
Fe2O3 wt. % 0.71 0.84 0.45 0.49 0.80 0.67 0.73 1.24 1.10 <0.01 <0.01 <0.01 <0.01 <0.01 <0.01 <0.01 0.51 0.23 <0.01 0.02 0.25 0.08 0.41 <0.01
Total wt. % 99.32 99.36 99.22 99.76 99.58 99.21 98.98 98.88 98.68 99.06 98.13 99.29 99.11 99.97 100.07 99.86 99.27 100.06 98.54 99.97 99.94 99.72 100.36 99.47
Na * <0.01 <0.01 <0.01 <0.01 <0.01 <0.01 <0.01 <0.01 <0.01 <0.01 <0.01 <0.01 <0.01 <0.01 <0.01 <0.01 <0.01 <0.01 <0.01 <0.01 <0.01 <0.01 <0.01 <0.01
K * <0.01 <0.01 <0.01 <0.01 <0.01 <0.01 <0.01 <0.01 <0.01 <0.01 <0.01 <0.01 <0.01 <0.01 <0.01 <0.01 <0.01 <0.01 <0.01 <0.01 <0.01 <0.01 <0.01 <0.01
Al * 0.04 0.04 0.03 0.04 0.04 0.05 0.06 0.06 0.06 0.07 0.05 0.05 0.05 0.06 0.06 0.06 0.06 0.04 0.05 0.04 0.04 0.03 0.04 0.05
Mg * 1.22 1.22 1.23 1.23 1.23 1.22 1.26 1.22 1.22 1.14 1.07 1.16 1.14 1.25 1.23 1.23 1.20 1.25 1.20 1.30 1.31 1.30 1.28 1.24
Si * 1.97 1.96 1.97 1.97 1.97 1.96 1.96 1.95 1.95 1.98 1.99 1.98 1.98 1.97 1.97 1.97 1.96 1.97 1.98 1.97 1.97 1.98 1.97 1.98
Ca * 0.06 0.05 0.03 0.04 0.04 0.04 0.04 0.05 0.06 0.07 0.04 0.11 0.15 0.03 0.11 0.03 0.13 0.13 0.07 0.03 0.03 0.03 0.06 0.04
Mn * 0.01 0.01 0.01 0.02 0.01 0.01 0.01 0.01 0.01 0.01 0.02 0.01 0.01 0.01 0.01 0.01 0.01 0.01 0.01 0.01 0.01 0.01 0.01 0.01
Ti * 0.01 0.01 0.01 0.01 0.01 <0.01 <0.01 <0.01 <0.01 0.01 <0.01 <0.01 <0.01 <0.01 <0.01 <0.01 <0.01 <0.01 0.01 0.01 0.01 0.01 0.01 0.01
Fe * 0.68 0.68 0.70 0.69 0.69 0.70 0.64 0.67 0.67 0.70 0.82 0.68 0.66 0.68 0.61 0.70 0.63 0.59 0.68 0.63 0.63 0.63 0.63 0.66
Ni * <0.01 <0.01 <0.01 <0.01 <0.01 <0.01 <0.01 <0.01 <0.01 <0.01 <0.01 <0.01 <0.01 <0.01 <0.01 <0.01 <0.01 <0.01 <0.01 <0.01 <0.01 <0.01 <0.01 <0.01
Cr * <0.01 <0.01 <0.01 <0.01 <0.01 <0.01 <0.01 <0.01 <0.01 <0.01 <0.01 <0.01 <0.01 <0.01 <0.01 <0.01 <0.01 <0.01 <0.01 <0.01 <0.01 <0.01 <0.01 <0.01
Fe3+ * 0.02 0.02 0.01 0.01 0.02 0.02 0.02 0.04 0.03 <0.01 <0.01 <0.01 <0.01 <0.01 <0.01 <0.01 0.01 0.01 <0.01 <0.01 0.01 <0.01 0.01 <0.01
Total * 4.00 4.00 4.00 4.00 4.00 4.00 4.00 3.99 4.00 3.98 3.98 3.99 3.99 3.99 3.99 4.00 4.00 3.99 3.99 4.00 4.00 4.00 4.00 3.99
WO % 2.82 2.67 1.51 1.86 2.06 1.81 2.13 2.37 2.83 3.78 2.08 5.68 7.46 1.33 5.58 1.47 6.38 6.55 3.66 1.60 1.58 1.54 2.88 1.99
EN % 61.81 61.87 62.44 62.29 62.27 62.04 64.39 62.48 62.25 59.18 55.10 58.98 58.22 63.66 62.55 62.61 61.20 63.16 61.24 65.85 66.16 65.78 64.68 63.59
FS % 35.37 35.46 36.05 35.85 35.67 36.16 33.49 35.15 34.92 37.04 42.81 35.34 34.32 35.00 31.87 35.93 32.42 30.29 35.10 32.55 32.26 32.68 32.44 34.42
SC19 SC20 SC20 SC20 SC20 SC20 SC20 SC21 SC21 SC21 SC21 SC25 SC25 SC25 SC25 SC25 SC25 SC25 SC26 SC26 SC26 SC26 SC26 SC27
OPX3.2 OPX1.1 OPX1.2 OPX2.1 OPX2.2 OPX3.2 OPX4.2 OPX1.1 OPX1.2 OPX2.1 OPX2.2 OPX1.1 OPX1.2 OPX1.3 OPX3.1 OPX3.2 CPX2.1 CPX2.1 OPX1.1 OPX1.2 OPX2.1 OPX2.2 OPX3.1 OPX1.1
Location (m) 1670.0 1748.0 1748.0 1748.0 1748.0 1748.0 1748.0 1800.0 1800.0 1800.0 1800.0 2171.0 2171.0 2171.0 2171.0 2171.0 2171.0 2171.0 2278.0 2278.0 2278.0 2278.0 2278.0 2448.0
Na2O wt. % 0.01 <0.01 <0.01 <0.01 0.01 <0.01 <0.01 0.02 0.01 0.01 <0.01 0.02 <0.01 <0.01 <0.01 <0.01 <0.01 <0.01 <0.01 0.02 0.01 <0.01 <0.01 <0.01
K2O wt. % 0.01 0.01 <0.01 0.01 <0.01 0.01 0.01 0.01 0.01 0.01 0.01 0.01 <0.01 <0.01 <0.01 <0.01 0.01 <0.01 <0.01 <0.01 <0.01 <0.01 0.01 0.01
Al2O3 wt. % 1.02 0.92 1.01 1.03 0.86 0.89 0.83 0.94 1.06 1.06 1.01 1.30 1.03 1.07 1.03 1.11 1.05 0.96 1.05 0.91 1.10 0.99 1.04 0.72
MgO wt. % 23.01 21.05 21.35 21.13 20.32 22.73 22.02 24.38 23.88 24.00 24.49 22.47 22.92 22.78 22.72 22.78 22.72 23.07 24.80 24.67 24.23 24.39 23.85 19.13
SiO2 wt. % 53.16 52.99 53.05 52.21 53.03 53.09 52.78 53.92 53.76 54.06 53.58 52.77 53.08 53.27 52.79 53.26 52.75 53.25 53.67 54.04 53.85 53.70 53.10 52.11
CaO wt. % 1.68 0.73 1.57 0.50 2.28 0.77 1.53 2.13 1.85 2.35 0.91 1.88 1.50 1.61 1.28 1.25 1.34 1.17 1.20 1.69 2.20 0.92 1.09 1.48
MnO wt. % 0.45 0.38 0.36 0.46 0.37 0.42 0.38 0.31 0.31 0.34 0.35 0.37 0.40 0.40 0.40 0.42 0.40 0.37 0.28 0.32 0.29 0.33 0.32 0.44
TiO2 wt. % 0.19 0.18 0.18 0.16 0.18 0.17 0.15 0.21 0.17 0.17 0.20 0.29 0.34 0.20 0.28 0.28 0.30 0.30 0.23 0.21 0.20 0.26 0.31 0.32
FeO wt. % 19.981 21.351 21.316 23.525 20.55 21.373 21.002 17.952 18.426 18.406 19.019 20.258 20.199 20.385 20.772 20.458 20.583 20.72 18.288 18.038 18.06 19.075 19.084 26.104
NiO wt. % 0.07 0.04 0.05 0.02 0.04 0.05 0.05 0.07 0.05 0.04 0.04 0.04 0.08 0.08 0.06 0.04 0.04 0.04 0.07 0.09 0.08 0.07 0.06 0.05
Cr2O3 wt. % 0.03 0.02 0.02 0.01 0.02 0.02 0.01 0.10 0.09 0.10 0.09 0.18 0.12 0.20 0.13 0.12 0.10 0.18 0.14 0.19 0.20 0.20 0.17 0.02
Fe2O3 wt. % 0.44 <0.01 <0.01 <0.01 <0.01 <0.01 <0.01 0.43 <0.01 <0.01 0.10 <0.01 <0.01 <0.01 0.03 <0.01 <0.01 <0.01 0.36 <0.01 <0.01 <0.01 <0.01 0.12
Total wt. % 100.03 97.66 98.90 99.06 97.67 99.51 98.75 100.48 99.63 100.54 99.78 99.57 99.66 99.98 99.49 99.72 99.29 100.06 100.10 100.17 100.21 99.93 99.03 100.48
Na * <0.01 <0.01 <0.01 <0.01 <0.01 <0.01 <0.01 <0.01 <0.01 <0.01 <0.01 <0.01 <0.01 <0.01 <0.01 <0.01 <0.01 <0.01 <0.01 <0.01 <0.01 <0.01 <0.01 <0.01
K * <0.01 <0.01 <0.01 <0.01 <0.01 <0.01 <0.01 <0.01 <0.01 <0.01 <0.01 <0.01 <0.01 <0.01 <0.01 <0.01 <0.01 <0.01 <0.01 <0.01 <0.01 <0.01 <0.01 <0.01
Al * 0.04 0.04 0.05 0.05 0.04 0.04 0.04 0.04 0.05 0.05 0.04 0.06 0.05 0.05 0.05 0.05 0.05 0.04 0.05 0.04 0.05 0.04 0.05 0.03
Mg * 1.27 1.19 1.19 1.19 1.15 1.26 1.23 1.33 1.31 1.31 1.34 1.25 1.27 1.26 1.26 1.26 1.26 1.27 1.35 1.34 1.32 1.34 1.32 1.08
Si * 1.97 2.01 1.99 1.98 2.01 1.98 1.98 1.97 1.98 1.97 1.97 1.96 1.97 1.97 1.97 1.97 1.97 1.97 1.96 1.97 1.97 1.97 1.97 1.97
Ca * 0.07 0.03 0.06 0.02 0.09 0.03 0.06 0.08 0.07 0.09 0.04 0.08 0.06 0.06 0.05 0.05 0.05 0.05 0.05 0.07 0.09 0.04 0.04 0.06
Mn * 0.01 0.01 0.01 0.02 0.01 0.01 0.01 0.01 0.01 0.01 0.01 0.01 0.01 0.01 0.01 0.01 0.01 0.01 0.01 0.01 0.01 0.01 0.01 0.01
Ti * 0.01 0.01 0.01 <0.01 0.01 0.01 <0.01 0.01 0.01 0.01 0.01 0.01 0.01 0.01 0.01 0.01 0.01 0.01 0.01 0.01 0.01 0.01 0.01 0.01
Fe * 0.62 0.68 0.67 0.74 0.65 0.67 0.66 0.55 0.57 0.56 0.59 0.63 0.63 0.63 0.65 0.63 0.64 0.64 0.56 0.55 0.55 0.59 0.59 0.83
Ni * <0.01 <0.01 <0.01 <0.01 <0.01 <0.01 <0.01 <0.01 <0.01 <0.01 <0.01 <0.01 <0.01 <0.01 <0.01 <0.01 <0.01 <0.01 <0.01 <0.01 <0.01 <0.01 <0.01 <0.01
Cr * <0.01 <0.01 <0.01 <0.01 <0.01 <0.01 <0.01 <0.01 <0.01 <0.01 <0.01 0.01 <0.01 0.01 <0.01 <0.01 <0.01 0.01 <0.01 0.01 0.01 0.01 0.01 <0.01
Fe3+ * 0.01 <0.01 <0.01 <0.01 <0.01 <0.01 <0.01 0.01 <0.01 <0.01 <0.01 <0.01 <0.01 <0.01 <0.01 <0.01 <0.01 <0.01 0.01 <0.01 <0.01 <0.01 <0.01 <0.01
Total * 4.00 3.96 3.98 3.99 3.96 4.00 3.99 3.99 3.99 3.99 3.99 4.00 3.99 4.00 3.99 3.99 3.99 4.00 3.99 4.00 4.00 4.00 3.99 4.00
WO % 3.38 1.54 3.25 1.03 4.87 1.56 3.13 4.24 3.73 4.66 1.82 3.82 3.03 3.25 2.58 2.53 2.71 2.36 2.39 3.35 4.38 1.84 2.21 3.03
EN % 64.48 62.33 61.63 60.45 60.30 64.01 62.70 67.42 66.84 66.29 68.00 63.48 64.46 63.98 63.97 64.37 64.08 64.53 68.73 68.17 67.10 67.86 67.14 54.52
FS % 32.14 36.12 35.12 38.52 34.84 34.43 34.17 28.34 29.43 29.05 30.18 32.70 32.51 32.77 33.45 33.10 33.22 33.11 28.88 28.47 28.52 30.30 30.65 42.45
SC27 SC27 SC27 SC27 SC7B SC7B SC7B SC7B SC7B SC7B SC10B SC10B SC10B SC10B SC10B
OPX1.2 OPX2.1 OPX2.2 OPX3.1 OPX1.1 OPX1.2 OPX2.1 3.1 OPX3.2 OPX4.1 OPX1.1 OPX1.2 OPX2.1 OPX3.1 OPX3.2
Location (m) 2448.0 2448.0 2448.0 2448.0 580.0 580.0 580.0 580.0 580.0 580.0 920.0 920.0 920.0 920.0 920.0
Na2O wt. % <0.01 <0.01 <0.01 <0.01 0.01 0.03 0.02 0.02 0.02 0.02 0.03 0.04 0.04 0.03 0.04
K2O wt. % <0.01 0.01 0.01 <0.01 0.01 <0.01 <0.01 <0.01 <0.01 <0.01 <0.01 0.01 <0.01 <0.01 <0.01
Al2O3 wt. % 0.71 0.71 0.74 0.68 0.70 0.72 0.82 0.73 0.71 0.74 1.18 1.16 1.16 1.13 1.16
MgO wt. % 19.16 18.61 18.96 19.17 33.76 33.98 33.54 33.63 33.79 33.96 34.22 34.00 34.07 33.75 33.79
SiO2 wt. % 52.09 51.27 51.69 52.13 57.95 58.03 57.63 57.72 57.69 57.88 58.17 58.04 58.04 58.08 58.03
CaO wt. % 1.25 1.22 1.47 1.15 0.58 0.59 0.59 0.58 0.57 0.55 0.84 0.85 0.89 0.91 0.87
MnO wt. % 0.49 0.45 0.43 0.49 0.12 0.15 0.13 0.14 0.11 0.13 0.12 0.08 0.13 0.11 0.12
TiO2 wt. % 0.32 0.31 0.30 0.20 0.04 0.02 0.03 0.03 0.03 0.04 0.04 0.05 0.04 0.07 0.04
FeO wt. % 26.038 25.875 25.481 25.58 6.675 6.61 6.682 6.749 6.664 6.697 5.721 5.693 5.637 5.77 5.683
NiO wt. % 0.03 0.02 0.04 0.01 0.11 0.09 0.10 0.13 0.06 0.10 0.09 0.07 0.09 0.09 0.10
Cr2O3 wt. % 0.02 0.03 <0.01 <0.01 0.58 0.62 0.72 0.65 0.61 0.66 0.69 0.67 0.65 0.69 0.66
Fe2O3 wt. % <0.01 <0.01 <0.01 <0.01 <0.01 <0.01 <0.01 <0.01 <0.01 <0.01 <0.01 <0.01 <0.01 <0.01 <0.01
Total wt. % 100.11 98.50 99.13 99.42 100.53 100.83 100.26 100.38 100.23 100.77 101.09 100.65 100.75 100.62 100.49
Na * <0.01 <0.01 <0.01 <0.01 <0.01 <0.01 <0.01 <0.01 <0.01 <0.01 <0.01 <0.01 <0.01 <0.01 <0.01
K * <0.01 <0.01 <0.01 <0.01 <0.01 <0.01 <0.01 <0.01 <0.01 <0.01 <0.01 <0.01 <0.01 <0.01 <0.01
Al * 0.03 0.03 0.03 0.03 0.03 0.03 0.03 0.03 0.03 0.03 0.05 0.05 0.05 0.05 0.05
Mg * 1.08 1.07 1.08 1.09 1.73 1.74 1.72 1.73 1.74 1.74 1.74 1.73 1.74 1.72 1.73
Si * 1.98 1.98 1.98 1.99 1.99 1.99 1.99 1.99 1.99 1.99 1.98 1.98 1.98 1.99 1.99
Ca * 0.05 0.05 0.06 0.05 0.02 0.02 0.02 0.02 0.02 0.02 0.03 0.03 0.03 0.03 0.03
Mn * 0.02 0.02 0.01 0.02 <0.01 <0.01 <0.01 <0.01 <0.01 <0.01 <0.01 <0.01 <0.01 <0.01 <0.01
Ti * 0.01 <0.01 <0.01 <0.01 <0.01 <0.01 <0.01 <0.01 <0.01 <0.01 <0.01 <0.01 <0.01 <0.01 <0.01
Fe * 0.83 0.84 0.82 0.82 0.19 0.19 0.19 0.19 0.19 0.19 0.16 0.16 0.16 0.17 0.16
Ni * <0.01 <0.01 <0.01 <0.01 <0.01 <0.01 <0.01 <0.01 <0.01 <0.01 <0.01 <0.01 <0.01 <0.01 <0.01
Cr * <0.01 <0.01 <0.01 <0.01 0.02 0.02 0.02 0.02 0.02 0.02 0.02 0.02 0.02 0.02 0.02
Fe3+ * <0.01 <0.01 <0.01 <0.01 <0.01 <0.01 <0.01 <0.01 <0.01 <0.01 <0.01 <0.01 <0.01 <0.01 <0.01
Total * 4.00 3.98 3.98 3.98 3.98 3.98 3.98 3.98 3.98 3.98 3.98 3.98 3.98 3.97 3.97
WO % 2.56 2.56 3.06 2.39 1.09 1.12 1.11 1.10 1.07 1.03 1.59 1.62 1.69 1.73 1.66
EN % 54.83 54.32 54.86 55.36 88.87 88.95 88.77 88.70 88.93 88.94 89.81 89.83 89.79 89.51 89.70
FS % 42.61 43.12 42.08 42.25 10.05 9.93 10.12 10.20 10.00 10.03 8.60 8.55 8.53 8.75 8.64
Sample
Analysis
SE
RR
A D
O O
NÇ
A C
OM
PLE
XS
ER
RA
DO
ON
ÇA
CO
MP
LE
X
Sample
Analysis
SE
RR
A D
O O
NÇ
A C
OM
PLE
X
Sample
Analysis
SE
RR
A D
O O
NÇ
A C
OM
PLE
X
Sample
Analysis
SE
RR
A D
O O
NÇ
A C
OM
PLE
X
Sample
Analysis

IV
SC33B SC33B SC33B SC33B SC33B SC34B SC34B SC34B SC34B SC36 SC36 SC36 SC36 SC36 SC36 SC36 SC36 SC37 SC37 SC37 SC37 SC37 SC37 SC37
OPX1.1 OPX1.2 OPX1.3 OPX1.4 OPX1.5 OPX1.1 OPX1.2 OPX1.3 OPX1.4 OPX1.1 OPX1.2 OPX1.3 OPX2.1 OPX2.2 OPX2.1 OPX2.2 OPX2.3 OPX1.2 OPX3.1 OPX4.1 OPX4.2 OPX4.3 OPX4.4 OPX4.5
Location (m) 2391.0 2391.0 2391.0 2391.0 2391.0 2254.0 2254.0 2254.0 2254.0 2130.0 2130.0 2130.0 2130.0 2130.0 2130.0 2130.0 2130.0 2073.0 2073.0 2073.0 2073.0 2073.0 2073.0 2073.0
Na2O wt. % <0.01 <0.01 <0.01 <0.01 <0.01 0.05 0.05 0.03 0.05 <0.01 <0.01 <0.01 0.05 0.04 <0.01 <0.01 <0.01 <0.01 <0.01 <0.01 <0.01 <0.01 <0.01 <0.01
K2O wt. % 0.01 0.01 0.02 0.01 0.01 <0.01 <0.01 0.01 <0.01 <0.01 0.01 0.01 <0.01 0.01 <0.01 0.01 0.01 <0.01 0.01 <0.01 <0.01 0.01 <0.01 0.01
Al2O3 wt. % 0.72 0.44 0.01 0.19 0.13 1.22 1.25 1.04 1.24 2.53 2.37 0.75 1.46 1.45 1.06 1.35 1.17 0.61 1.61 0.40 1.62 0.44 1.84 2.71
MgO wt. % 30.87 31.09 43.77 31.28 31.38 27.69 27.94 28.03 27.61 30.10 30.36 28.68 28.33 28.24 29.57 28.35 29.94 29.53 29.91 31.22 30.70 31.36 30.61 29.72
SiO2 wt. % 56.43 56.78 39.65 57.23 57.62 54.66 54.28 55.21 54.83 54.90 55.80 55.77 54.53 54.71 55.25 54.98 56.18 56.08 56.31 57.03 56.05 57.40 56.10 55.16
CaO wt. % 0.20 0.20 0.02 0.23 0.23 1.99 2.00 2.04 1.99 0.06 0.07 0.18 1.97 2.03 0.09 0.06 0.09 0.13 0.08 0.09 0.09 0.07 0.10 0.06
MnO wt. % 0.30 0.27 0.18 0.29 0.27 0.28 0.27 0.27 0.30 0.50 0.49 0.43 0.27 0.27 0.52 0.45 0.56 0.40 0.52 0.47 0.46 0.46 0.44 0.50
TiO2 wt. % 0.03 0.01 <0.01 0.01 <0.01 0.29 0.27 0.26 0.32 <0.01 0.01 0.02 0.35 0.35 <0.01 <0.01 <0.01 0.01 0.02 <0.01 0.02 <0.01 0.02 0.01
FeO wt. % 11.722 11.222 0 11.213 10.895 12.912 12.238 12.717 13.047 11.321 11.37 14.442 11.914 12.261 12.488 14.625 12.429 13.373 12.272 10.902 11.413 11.543 11.189 11.959
NiO wt. % 0.06 0.07 0.37 0.06 0.08 0.08 0.07 0.08 0.09 0.04 0.04 0.03 0.07 0.05 0.03 0.04 0.04 0.03 0.03 0.04 0.05 0.04 0.02 0.04
Cr2O3 wt. % 0.05 0.05 0.02 0.06 0.08 0.39 0.30 0.32 0.37 0.03 0.02 0.08 0.41 0.45 0.05 0.03 0.04 0.13 0.04 0.04 0.05 0.03 0.05 <0.01
Fe2O3 wt. % <0.01 <0.01 51.89 <0.01 <0.01 <0.01 0.36 <0.01 <0.01 <0.01 <0.01 <0.01 0.52 0.03 <0.01 0.12 <0.01 <0.01 <0.01 <0.01 <0.01 <0.01 <0.01 0.00
Total wt. % 100.40 100.14 135.90 100.57 100.69 99.56 99.02 100.00 99.83 99.47 100.55 100.39 99.89 99.89 99.06 100.01 100.46 100.30 100.82 100.19 100.44 101.36 100.36 100.16
Na * <0.01 <0.01 <0.01 <0.01 <0.01 <0.01 <0.01 <0.01 <0.01 <0.01 <0.01 <0.01 <0.01 <0.01 <0.01 <0.01 <0.01 <0.01 <0.01 <0.01 <0.01 <0.01 <0.01 <0.01
K * <0.01 <0.01 <0.01 <0.01 <0.01 <0.01 <0.01 <0.01 <0.01 <0.01 <0.01 <0.01 <0.01 <0.01 <0.01 <0.01 <0.01 <0.01 <0.01 <0.01 <0.01 <0.01 <0.01 <0.01
Al * 0.03 0.02 <0.01 0.01 0.01 0.05 0.05 0.04 0.05 0.11 0.10 0.03 0.06 0.06 0.05 0.06 0.05 0.03 0.07 0.02 0.07 0.02 0.08 0.11
Mg * 1.62 1.63 1.92 1.63 1.63 1.48 1.50 1.49 1.48 1.59 1.59 1.52 1.51 1.50 1.58 1.51 1.57 1.56 1.57 1.63 1.61 1.63 1.60 1.56
Si * 1.99 2.00 1.17 2.00 2.01 1.97 1.96 1.97 1.97 1.95 1.96 1.99 1.95 1.96 1.98 1.97 1.98 1.99 1.98 2.00 1.97 2.00 1.97 1.95
Ca * 0.01 0.01 <0.01 0.01 0.01 0.08 0.08 0.08 0.08 <0.01 <0.01 0.01 0.08 0.08 <0.01 <0.01 <0.01 0.01 <0.01 <0.01 <0.01 <0.01 <0.01 <0.01
Mn * 0.01 0.01 <0.01 0.01 0.01 0.01 0.01 0.01 0.01 0.02 0.02 0.01 0.01 0.01 0.02 0.01 0.02 0.01 0.02 0.01 0.01 0.01 0.01 0.02
Ti * <0.01 <0.01 <0.01 <0.01 <0.01 0.01 0.01 0.01 0.01 <0.01 <0.01 <0.01 0.01 0.01 <0.01 <0.01 <0.01 <0.01 <0.01 <0.01 <0.01 <0.01 <0.01 <0.01
Fe * 0.35 0.33 0.00 0.33 0.32 0.39 0.37 0.38 0.39 0.34 0.33 0.43 0.36 0.37 0.37 0.44 0.37 0.40 0.36 0.32 0.34 0.34 0.33 0.35
Ni * <0.01 <0.01 0.01 <0.01 <0.01 <0.01 <0.01 <0.01 <0.01 <0.01 <0.01 <0.01 <0.01 <0.01 <0.01 <0.01 <0.01 <0.01 <0.01 <0.01 <0.01 <0.01 <0.01 <0.01
Cr * <0.01 <0.01 <0.01 <0.01 <0.01 0.01 0.01 0.01 0.01 <0.01 <0.01 <0.01 0.01 0.01 <0.01 <0.01 <0.01 <0.01 <0.01 <0.01 <0.01 <0.01 <0.01 <0.01
Fe3+ * <0.01 <0.01 1.15 <0.01 <0.01 <0.01 0.01 <0.01 <0.01 <0.01 <0.01 <0.01 0.01 <0.01 <0.01 <0.01 <0.01 <0.01 <0.01 <0.01 <0.01 <0.01 <0.01 <0.01
Total * 3.99 3.99 4.25 3.99 3.98 3.99 4.00 3.99 3.99 4.00 3.99 3.99 3.99 3.99 3.99 3.99 3.99 3.99 3.98 3.99 3.99 3.99 3.99 3.99
WO % 0.38 0.37 0.03 0.44 0.43 3.91 3.95 3.98 3.92 0.12 0.13 0.35 3.86 3.97 0.18 0.11 0.18 0.25 0.16 0.17 0.17 0.13 0.19 0.11
EN % 81.75 82.52 99.74 82.53 83.00 75.82 76.77 76.21 75.58 81.84 81.90 77.19 77.44 76.89 80.05 76.92 80.27 79.05 80.51 82.88 82.03 82.21 82.27 80.87
FS % 17.87 17.11 0.23 17.04 16.57 20.27 19.28 19.81 20.50 18.04 17.97 22.46 18.69 19.15 19.77 22.96 19.55 20.70 19.33 16.95 17.81 17.67 17.54 19.02
SC38 SC38 SC38 SC38 SC38 SC38 SC39 SC39 SC39 SC39 SC39 SC39 SC39 SC39 SC40A SC40A SC40A SC40A SC40A SC40A SC40A SC40A SC41 SC41
OPX3.1 OPX3.2 OPX4.1 OPX4.2 OPX4.3 OPX4.4 OPX1.1 OPX1.2 OPX1.3 OPX2.1 OPX2.2 OPX2.3 OPX3.1 OPX3.2 OPX1.1 OPX1.2 OPX1.3 OPX1.1 OPX1.2 OPX1.3 OPX1.4 OPX1.4 OPX1.1 OPX1.2
Location (m) 2029.0 2029.0 2029.0 2029.0 2029.0 2029.0 1998.0 1998.0 1998.0 1998.0 1998.0 1998.0 1998.0 1998.0 1930.0 1930.0 1930.0 1930.0 1930.0 1930.0 1930.0 1930.0 1850.0 1850.0
Na2O wt. % <0.01 <0.01 <0.01 <0.01 <0.01 0.01 <0.01 0.01 <0.01 0.05 0.04 <0.01 0.05 0.02 <0.01 <0.01 <0.01 0.06 0.05 0.01 0.05 <0.01 <0.01 <0.01
K2O wt. % 0.03 0.01 0.01 <0.01 0.01 <0.01 <0.01 <0.01 <0.01 <0.01 <0.01 0.01 0.01 0.01 <0.01 0.03 <0.01 0.01 0.01 0.01 <0.01 <0.01 <0.01 <0.01
Al2O3 wt. % 2.96 1.40 2.17 2.68 1.89 1.64 1.03 1.26 0.85 1.41 1.31 0.29 1.19 1.08 0.28 0.21 0.22 1.00 1.27 0.34 1.23 0.18 0.77 0.60
MgO wt. % 30.65 31.16 28.20 27.53 30.34 28.75 28.60 28.81 29.56 28.22 28.43 31.25 28.78 28.98 29.86 29.91 30.06 29.06 28.93 29.38 29.01 30.03 31.28 31.17
SiO2 wt. % 55.46 56.21 55.12 54.20 55.32 55.79 55.76 55.45 55.85 54.97 55.11 57.53 55.32 55.31 56.86 57.04 57.33 55.71 55.78 56.25 55.62 57.38 57.75 56.82
CaO wt. % 0.07 0.06 0.17 0.19 0.04 0.06 0.15 1.36 0.83 2.05 1.99 0.10 1.91 0.10 0.31 0.28 0.22 1.88 1.92 0.09 1.94 0.28 0.08 0.10
MnO wt. % 0.39 0.41 0.34 0.35 0.44 0.58 0.32 0.27 0.26 0.27 0.24 0.38 0.28 0.38 0.36 0.34 0.35 0.24 0.24 0.37 0.28 0.37 0.41 0.39
TiO2 wt. % 0.02 0.01 0.01 0.03 <0.01 <0.01 0.02 0.48 0.24 0.39 0.38 <0.01 0.35 <0.01 0.03 0.03 0.03 0.32 0.35 0.01 0.36 0.03 0.01 0.01
FeO wt. % 10.455 10.45 14.391 14.715 11.34 13.78 14.223 12.44 12.386 12.276 12.211 11.157 11.687 13.359 13.235 12.456 12.998 11.577 11.536 13.207 11.812 12.943 11.092 10.823
NiO wt. % 0.03 0.03 0.05 0.06 0.04 <0.01 0.03 0.05 0.05 0.04 0.09 0.01 0.05 0.04 0.04 0.02 0.03 0.06 0.06 0.01 0.05 0.04 0.03 0.04
Cr2O3 wt. % 0.02 0.02 0.06 0.05 <0.01 0.02 0.06 0.26 0.17 0.40 0.40 <0.01 0.32 0.05 0.08 0.05 0.05 0.34 0.34 0.02 0.40 0.07 <0.01 0.02
Fe2O3 wt. % <0.01 <0.01 <0.01 <0.01 <0.01 <0.01 <0.01 <0.01 <0.01 <0.01 <0.01 <0.01 <0.01 <0.01 <0.01 <0.01 <0.01 <0.01 <0.01 <0.01 <0.01 <0.01 <0.01 <0.01
Total wt. % 100.06 99.76 100.53 99.80 99.41 100.62 100.19 100.38 100.19 100.06 100.19 100.73 99.94 99.30 101.06 100.36 101.28 100.25 100.47 99.69 100.76 101.32 101.41 99.98
Na * <0.01 <0.01 <0.01 <0.01 <0.01 <0.01 <0.01 <0.01 <0.01 <0.01 <0.01 <0.01 <0.01 <0.01 <0.01 <0.01 <0.01 <0.01 <0.01 <0.01 <0.01 <0.01 <0.01 <0.01
K * <0.01 <0.01 <0.01 <0.01 <0.01 <0.01 <0.01 <0.01 <0.01 <0.01 <0.01 <0.01 <0.01 <0.01 <0.01 <0.01 <0.01 <0.01 <0.01 <0.01 <0.01 <0.01 <0.01 <0.01
Al * 0.12 0.06 0.09 0.11 0.08 0.07 0.04 0.05 0.04 0.06 0.06 0.01 0.05 0.05 0.01 0.01 0.01 0.04 0.05 0.01 0.05 0.01 0.03 0.03
Mg * 1.60 1.63 1.49 1.47 1.60 1.52 1.52 1.52 1.56 1.50 1.51 1.63 1.53 1.55 1.57 1.57 1.57 1.53 1.52 1.56 1.53 1.57 1.62 1.63
Si * 1.95 1.98 1.96 1.95 1.96 1.98 1.99 1.97 1.98 1.96 1.96 2.01 1.97 1.98 2.00 2.01 2.01 1.97 1.97 2.00 1.96 2.01 2.00 2.00
Ca * <0.01 <0.01 0.01 0.01 <0.01 <0.01 0.01 0.05 0.03 0.08 0.08 <0.01 0.07 <0.01 0.01 0.01 0.01 0.07 0.07 <0.01 0.07 0.01 <0.01 <0.01
Mn * 0.01 0.01 0.01 0.01 0.01 0.02 0.01 0.01 0.01 0.01 0.01 0.01 0.01 0.01 0.01 0.01 0.01 0.01 0.01 0.01 0.01 0.01 0.01 0.01
Ti * <0.01 <0.01 <0.01 <0.01 <0.01 <0.01 <0.01 0.01 0.01 0.01 0.01 0.00 0.01 <0.01 <0.01 <0.01 <0.01 0.01 0.01 <0.01 0.01 <0.01 <0.01 <0.01
Fe * 0.31 0.31 0.43 0.44 0.34 0.41 0.42 0.37 0.37 0.37 0.36 0.33 0.35 0.40 0.39 0.37 0.38 0.34 0.34 0.39 0.35 0.38 0.32 0.32
Ni * <0.01 <0.01 <0.01 <0.01 <0.01 <0.01 <0.01 <0.01 <0.01 <0.01 <0.01 <0.01 <0.01 <0.01 <0.01 <0.01 <0.01 <0.01 <0.01 <0.01 <0.01 <0.01 <0.01 <0.01
Cr * <0.01 <0.01 <0.01 <0.01 <0.01 <0.01 <0.01 0.01 0.01 0.01 0.01 <0.01 0.01 <0.01 <0.01 <0.01 <0.01 0.01 0.01 <0.01 0.01 <0.01 <0.01 <0.01
Fe3+ * <0.01 <0.01 <0.01 <0.01 <0.01 <0.01 <0.01 <0.01 <0.01 <0.01 <0.01 <0.01 0.00 <0.01 <0.01 <0.01 <0.01 <0.01 <0.01 <0.01 <0.01 <0.01 <0.01 <0.01
Total * 3.99 3.99 3.99 3.99 3.99 3.99 3.99 3.99 3.99 3.99 3.99 3.98 3.99 3.99 3.99 3.98 3.98 3.99 3.99 3.98 3.99 3.98 3.98 3.98
WO % 0.14 0.12 0.34 0.39 0.07 0.11 0.29 2.64 1.60 4.01 3.88 0.18 3.73 0.19 0.59 0.53 0.42 3.65 3.74 0.17 3.75 0.53 0.15 0.20
EN % 83.32 83.54 77.07 76.21 82.05 78.01 77.58 78.04 79.35 76.82 77.16 82.68 78.06 78.84 79.18 80.20 79.71 78.45 78.36 79.27 78.00 79.65 82.77 83.03
FS % 16.54 16.34 22.60 23.40 17.88 21.88 22.13 19.32 19.05 19.17 18.96 17.13 18.21 20.97 20.24 19.27 19.87 17.90 17.90 20.56 18.25 19.82 17.08 16.77
SC41 SC41 SC41 SC41 SC41 SC46 SC46 SC46 SC46 SC46 SC46 SC47A SC47A SC47A SC47A SC47A SC48 SC48 SC48
OPX1.3 OPX1.4 OPX2.1 OPX2.1 OPX3.3 OPX1.1 OPX1.2 OPX1.3 OPX2.1 OPX2.2 OPX2.3 OPX1.1 OPX1.2 OPX1.3 OPX1.4 OPX1.5 OPX1.1 OPX2.1 OPX3.1
Location (m) 1850.0 1850.0 1850.0 1850.0 1850.0 1213.0 1213.0 1213.0 1213.0 1213.0 1213.0 1184.0 1184.0 1184.0 1184.0 1184.0 1145.0 1145.0 1145.0
Na2O wt. % 0.05 <0.01 0.35 0.01 <0.01 0.02 0.04 0.03 0.02 0.03 0.03 0.01 0.02 0.01 0.02 0.02 0.36 0.35 0.39
K2O wt. % <0.01 <0.01 0.02 0.02 0.01 <0.01 <0.01 <0.01 <0.01 <0.01 0.01 <0.01 0.01 0.01 0.01 0.01 0.01 <0.01 0.02
Al2O3 wt. % 1.18 1.22 2.80 1.18 0.09 0.91 0.87 0.87 0.89 0.89 0.88 0.91 0.88 0.76 0.95 0.88 2.10 2.25 2.58
MgO wt. % 28.94 29.55 15.86 27.60 30.77 29.26 29.45 29.30 29.12 29.49 29.41 30.13 30.04 30.21 30.23 29.92 17.84 17.13 16.56
SiO2 wt. % 55.80 55.64 51.37 54.38 57.84 55.77 56.30 55.92 56.47 56.73 56.52 56.37 56.45 55.80 56.51 56.65 53.61 53.42 53.28
CaO wt. % 1.95 0.95 20.18 0.17 0.06 1.74 1.74 1.74 1.82 1.78 1.80 1.61 1.93 1.25 1.65 1.91 20.44 20.74 21.48
MnO wt. % 0.24 0.26 0.11 0.34 0.52 0.19 0.18 0.18 0.21 0.20 0.21 0.19 0.18 0.23 0.21 0.19 0.11 0.10 0.10
TiO2 wt. % 0.33 0.34 0.24 0.00 0.01 0.30 0.28 0.28 0.29 0.31 0.27 0.17 0.18 0.13 0.18 0.18 0.15 0.19 0.21
FeO wt. % 11.641 11.933 4.948 12.77 11.965 11.846 12.076 11.988 11.957 11.759 11.696 10.386 10.227 10.461 10.171 10.346 4.364 4.413 4.266
NiO wt. % 0.08 0.06 0.03 0.03 0.02 0.08 0.12 0.10 0.09 0.09 0.11 0.10 0.10 0.09 0.08 0.11 0.07 0.08 0.03
Cr2O3 wt. % 0.33 0.20 0.96 0.10 0.00 0.20 0.15 0.15 0.19 0.19 0.16 0.10 0.12 0.12 0.13 0.11 1.21 1.15 1.13
Fe2O3 wt. % <0.01 <0.01 <0.01 <0.01 <0.01 <0.01 <0.01 <0.01 <0.01 <0.01 <0.01 <0.01 <0.01 <0.01 <0.01 <0.01 <0.01 <0.01 <0.01
Total wt. % 100.54 100.15 96.86 96.59 101.28 100.32 101.18 100.54 101.06 101.45 101.10 99.99 100.13 99.08 100.14 100.33 100.28 99.83 100.05
Na * <0.01 <0.01 0.03 <0.01 <0.01 <0.01 <0.01 <0.01 <0.01 <0.01 <0.01 <0.01 <0.01 <0.01 <0.01 <0.01 0.03 0.03 0.03
K * <0.01 <0.01 <0.01 <0.01 <0.01 <0.01 <0.01 <0.01 <0.01 <0.01 <0.01 <0.01 <0.01 <0.01 <0.01 <0.01 <0.01 <0.01 <0.01
Al * 0.05 0.05 0.12 0.05 0.00 0.04 0.04 0.04 0.04 0.04 0.04 0.04 0.04 0.03 0.04 0.04 0.09 0.10 0.11
Mg * 1.52 1.56 0.89 1.51 1.60 1.54 1.54 1.54 1.53 1.54 1.54 1.58 1.58 1.60 1.58 1.57 0.97 0.93 0.90
Si * 1.97 1.97 1.94 2.00 2.02 1.98 1.98 1.98 1.98 1.98 1.98 1.99 1.99 1.99 1.99 1.99 1.95 1.95 1.94
Ca * 0.07 0.04 0.82 0.01 <0.01 0.07 0.07 0.07 0.07 0.07 0.07 0.06 0.07 0.05 0.06 0.07 0.80 0.81 0.84
Mn * 0.01 0.01 <0.01 0.01 0.02 0.01 0.01 0.01 0.01 0.01 0.01 0.01 0.01 0.01 0.01 0.01 <0.01 <0.01 <0.01
Ti * 0.01 0.01 0.01 <0.01 <0.01 0.01 0.01 0.01 0.01 0.01 0.01 0.01 0.01 <0.01 0.01 0.01 <0.01 0.01 0.01
Fe * 0.34 0.35 0.16 0.39 0.35 0.35 0.36 0.35 0.35 0.34 0.34 0.31 0.30 0.31 0.30 0.30 0.13 0.14 0.13
Ni * <0.01 <0.01 <0.01 <0.01 <0.01 <0.01 <0.01 <0.01 <0.01 <0.01 <0.01 <0.01 <0.01 <0.01 <0.01 <0.01 <0.01 <0.01 <0.01
Cr * 0.01 0.01 0.03 <0.01 <0.01 0.01 <0.01 <0.01 0.01 0.01 <0.01 <0.01 <0.01 <0.01 <0.01 <0.01 0.04 0.03 0.03
Fe3+ * <0.01 <0.01 <0.01 <0.01 <0.01 <0.01 <0.01 <0.01 <0.01 <0.01 <0.01 <0.01 <0.01 <0.01 <0.01 <0.01 <0.01 <0.01 <0.01
Total * 3.99 3.99 3.99 3.97 3.98 3.99 3.99 3.99 3.99 3.99 3.98 3.98 3.98 3.99 3.98 3.98 3.99 3.99 3.99
WO % 3.79 1.84 43.69 0.35 0.11 3.35 3.32 3.34 3.52 3.42 3.47 3.12 3.72 2.43 3.19 3.68 41.93 43.12 44.81
EN % 78.19 79.70 47.76 78.68 81.36 78.52 78.37 78.39 78.16 78.67 78.66 80.94 80.61 81.41 81.16 80.42 50.91 49.55 48.07
FS % 18.01 18.46 8.55 20.98 18.54 18.13 18.30 18.27 18.32 17.91 17.88 15.95 15.68 16.17 15.65 15.90 7.16 7.33 7.12
SE
RR
A D
O P
UM
A C
OM
PLE
X
Sample
Analysis
SE
RR
A D
O P
UM
A C
OM
PLE
X
Sample
Analysis
SE
RR
A D
O P
UM
A C
OM
PLE
X
Sample
Analysis

V
SC22 SC22 SC22 SC23 SC23 SC23 SC23 SC23 SC23 SC24A SC24A SC24A SC11 SC11 SC11 SC11 SC11 SC12 SC12 SC12 SC12 SC13 SC13 SC13
CPX5.1 CPX5.2 CPX5.3 CPX1.1 CPX1.2 CPX2.2 CPX2.3 CPX3.2 CPX3.3 CPX3.1 CPX3.2 CPX4.1 CPX1.1 CPX2.1 CPX2.2 CPX3.1 CPX3.3 OPX1.4 CPX2.3 CPX2.1 CPX3.2 CPX1.2 CPX2.1 CPX2.2
Location (m) 1898.0 1898.0 1898.0 1987.0 1987.0 1987.0 1987.0 1987.0 1987.0 2081.0 2081.0 2081.0 1060.0 1060.0 1060.0 1060.0 1060.0 1120.0 1120.0 1120.0 1120.0 1135.0 1135.0 1135.0
Na2O wt. % 0.27 0.33 0.34 0.26 0.28 0.25 0.28 0.27 0.25 0.32 0.35 0.38 0.21 0.23 0.24 0.22 0.22 0.26 0.24 0.27 0.26 0.26 0.26 0.25
K2O wt. % <0.01 <0.01 <0.01 <0.01 <0.01 0.01 <0.01 0.04 <0.01 <0.01 0.05 <0.01 0.01 <0.01 0.03 <0.01 <0.01 <0.01 <0.01 <0.01 <0.01 <0.01 <0.01 <0.01
Al2O3 wt. % 2.00 2.07 2.05 1.89 2.10 2.02 2.03 1.98 1.70 2.14 2.19 2.13 2.05 1.87 1.93 1.82 1.85 1.36 1.62 1.84 1.76 1.76 1.81 1.88
MgO wt. % 17.09 14.72 15.03 14.65 13.39 14.19 13.86 13.65 15.24 14.32 13.96 13.97 16.26 16.15 15.59 16.06 15.87 15.30 15.05 14.87 14.85 15.42 15.08 15.87
SiO2 wt. % 51.69 50.84 51.14 50.78 50.99 51.09 51.10 51.21 51.28 50.45 50.65 51.15 51.95 51.79 52.08 51.89 52.08 52.18 52.14 52.08 51.96 52.82 52.68 52.55
CaO wt. % 16.12 20.98 19.64 19.48 20.99 18.27 19.97 20.30 18.66 19.39 21.15 20.30 18.91 20.38 21.87 21.01 20.16 21.94 21.14 21.75 21.94 20.96 20.85 21.48
MnO wt. % 0.22 0.21 0.17 0.26 0.29 0.24 0.23 0.23 0.24 0.22 0.22 0.18 0.16 0.21 0.14 0.15 0.14 0.14 0.20 0.17 0.17 0.18 0.23 0.19
TiO2 wt. % 0.35 0.38 0.41 0.42 0.42 0.38 0.45 0.39 0.38 0.43 0.43 0.38 0.13 0.15 0.13 0.18 0.15 0.21 0.21 0.24 0.22 0.18 0.18 0.19
FeO wt. % 9.507 6.212 7.792 8.532 8.998 11.312 9.663 9.68 9.166 8.596 6.939 8.646 7.093 5.846 5.148 5.412 6.553 5.826 7.308 6.639 6.388 7.556 8.092 5.82
NiO wt. % 0.03 0.04 0.05 0.05 0.02 0.02 0.04 0.01 0.03 0.04 0.05 0.02 0.06 0.06 0.06 0.06 0.08 0.01 0.03 0.05 0.02 0.04 0.02 0.03
Cr2O3 wt. % 0.29 0.28 0.29 0.03 0.01 0.03 0.02 0.04 0.03 0.36 0.35 0.34 0.08 0.07 0.08 0.08 0.11 0.02 0.04 0.05 0.05 0.03 0.06 0.10
Fe2O3 wt. % 1.22 1.99 0.97 2.71 1.70 0.75 1.21 1.19 2.47 2.38 2.59 1.10 <0.01 0.97 0.83 0.77 <0.01 1.08 0.23 0.86 0.88 0.79 0.17 2.04
Total wt. % 98.78 98.05 97.86 99.05 99.18 98.55 98.85 98.98 99.45 98.63 98.92 98.60 96.91 97.72 98.12 97.64 97.20 98.33 98.20 98.83 98.49 100.00 99.44 100.40
Na * 0.02 0.03 0.03 0.02 0.02 0.02 0.02 0.02 0.02 0.02 0.03 0.03 0.02 0.02 0.02 0.02 0.02 0.02 0.02 0.02 0.02 0.02 0.02 0.02
K * <0.01 <0.01 <0.01 <0.01 <0.01 <0.01 <0.01 <0.01 <0.01 <0.01 <0.01 <0.01 <0.01 <0.01 <0.01 <0.01 <0.01 <0.01 <0.01 <0.01 <0.01 <0.01 <0.01 <0.01
Al * 0.09 0.09 0.09 0.08 0.09 0.09 0.09 0.09 0.08 0.10 0.10 0.10 0.09 0.08 0.09 0.08 0.08 0.06 0.07 0.08 0.08 0.08 0.08 0.08
Mg * 0.95 0.83 0.85 0.82 0.75 0.80 0.78 0.77 0.85 0.81 0.79 0.79 0.92 0.91 0.87 0.90 0.89 0.86 0.84 0.83 0.83 0.85 0.84 0.87
Si * 1.93 1.92 1.94 1.92 1.93 1.94 1.94 1.94 1.93 1.91 1.91 1.94 1.97 1.95 1.95 1.95 1.97 1.96 1.96 1.95 1.95 1.95 1.96 1.93
Ca * 0.65 0.85 0.80 0.79 0.85 0.74 0.81 0.82 0.75 0.79 0.86 0.82 0.77 0.82 0.88 0.85 0.82 0.88 0.85 0.87 0.88 0.83 0.83 0.85
Mn * 0.01 0.01 0.01 0.01 0.01 0.01 0.01 0.01 0.01 0.01 0.01 0.01 0.01 0.01 0.01 0.01 0.01 <0.01 0.01 0.01 0.01 0.01 0.01 0.01
Ti * 0.01 0.01 0.01 0.01 0.01 0.01 0.01 0.01 0.01 0.01 0.01 0.01 <0.01 <0.01 <0.01 0.01 <0.01 0.01 0.01 0.01 0.01 0.01 0.01 0.01
Fe * 0.30 0.20 0.25 0.27 0.28 0.36 0.31 0.31 0.29 0.27 0.22 0.27 0.22 0.18 0.16 0.17 0.21 0.18 0.23 0.21 0.20 0.23 0.25 0.18
Ni * <0.01 <0.01 <0.01 <0.01 <0.01 <0.01 <0.01 <0.01 <0.01 <0.01 <0.01 <0.01 <0.01 <0.01 <0.01 <0.01 <0.01 <0.01 <0.01 <0.01 <0.01 <0.01 <0.01 <0.01
Cr * 0.01 0.01 0.01 <0.01 <0.01 <0.01 <0.01 <0.01 <0.01 0.01 0.01 0.01 <0.01 <0.01 <0.01 <0.01 <0.01 <0.01 <0.01 <0.01 <0.01 <0.01 <0.01 <0.01
Fe3+ * 0.03 0.06 0.03 0.08 0.05 0.02 0.03 0.03 0.07 0.07 0.07 0.03 <0.01 0.03 0.02 0.02 <0.01 0.03 0.01 0.02 0.03 0.02 0.01 0.06
Total *
WO % 33.95 45.14 42.00 41.70 44.79 38.85 42.50 43.17 39.53 41.97 45.82 43.54 40.07 42.83 45.86 44.05 42.47 45.83 44.11 45.55 45.98 43.26 43.14 44.52
EN % 50.06 44.07 44.71 43.62 39.74 41.97 41.05 40.37 44.91 43.13 42.07 41.68 47.93 47.23 45.48 46.85 46.51 44.46 43.67 43.31 43.30 44.28 43.41 45.76
FS % 15.99 10.80 13.30 14.68 15.47 19.18 16.45 16.46 15.56 14.90 12.11 14.79 12.00 9.95 8.66 9.10 11.02 9.72 12.23 11.14 10.72 12.47 13.45 9.72
SC13 SC14 SC14 SC14 SC14 SC14 SC15 SC15 SC15 SC15 SC16B SC16B SC16B SC16B SC16B SC17 SC17 SC17 SC17 SC17 SC17 SC18 SC18 SC18
CPX2.3 CPX1.1 CPX1.3 CPX2.2 CPX3.1 CPX3.3 CPX1.1 CPX1.3 CPX2.1 CPX2.2 CPX1.1 CPX1.2 CPX2.1 CPX2.2 CPX3.1 CPX1.1 CPX1.2 CPX2.1 OPX2.1 CPX3.1 CPX3.3 CPX1.1 CPX2.1 CPX2.3
Location (m) 1135.0 1225.0 1225.0 1225.0 1225.0 1225.0 1370.0 1370.0 1370.0 1788.3 1445.0 1445.0 1445.0 1445.0 1445.0 1500.0 1500.0 1500.0 1500.0 1500.0 1500.0 1565.0 1565.0 1565.0
Na2O wt. % 0.26 0.29 0.27 0.20 0.18 0.19 0.28 0.31 0.33 0.28 0.36 0.33 0.31 0.29 0.31 0.35 0.36 0.33 0.25 0.34 0.31 0.37 0.30 0.32
K2O wt. % 0.01 <0.01 <0.01 <0.01 <0.01 <0.01 0.01 <0.01 0.02 0.01 0.02 <0.01 <0.01 <0.01 0.01 0.01 0.01 <0.01 0.01 0.01 <0.01 <0.01 0.01 0.01
Al2O3 wt. % 1.89 1.84 1.91 1.66 1.79 1.82 1.76 1.81 1.84 1.82 2.08 1.93 1.71 1.66 1.80 2.24 2.36 2.63 1.84 2.35 2.59 2.68 2.42 2.54
MgO wt. % 15.06 15.20 16.23 16.08 16.57 16.55 15.58 14.40 14.37 14.29 13.50 14.00 13.87 14.11 14.00 13.48 13.49 13.24 15.08 14.34 13.53 13.43 13.53 13.26
SiO2 wt. % 52.53 52.34 52.17 52.40 52.21 52.51 51.66 51.80 51.85 51.99 51.14 51.33 51.77 51.91 51.40 50.86 50.91 50.34 50.83 50.94 50.65 51.24 51.21 51.14
CaO wt. % 22.04 21.67 21.08 17.52 15.05 17.35 19.01 21.34 21.91 21.55 21.96 20.58 21.10 20.75 21.00 20.27 21.50 20.01 20.67 18.62 18.92 20.60 21.42 20.99
MnO wt. % 0.16 0.19 0.22 0.27 0.23 0.21 0.26 0.21 0.17 0.20 0.23 0.25 0.25 0.22 0.28 0.18 0.21 0.22 0.18 0.31 0.27 0.20 0.18 0.20
TiO2 wt. % 0.21 0.21 0.27 0.23 0.25 0.25 0.28 0.28 0.29 0.27 0.37 0.38 0.37 0.36 0.34 0.34 0.36 0.35 0.27 0.32 0.37 0.32 0.31 0.31
FeO wt. % 6.492 6.353 5.223 10.519 12.279 10.193 8.27 7.479 6.789 7.739 7.312 8.618 8.8 9.078 8.142 9.258 7.713 9.51 6.276 9.877 10.852 9.288 8.343 9.199
NiO wt. % 0.03 0.02 <0.01 0.04 0.04 0.01 0.06 0.07 0.02 0.06 0.02 0.01 <0.01 0.02 <0.01 0.06 <0.01 0.03 0.01 <0.01 <0.01 <0.01 0.01 <0.01
Cr2O3 wt. % 0.06 0.05 0.08 0.08 0.05 0.05 0.08 0.06 0.05 0.06 0.04 0.03 0.08 0.05 0.04 0.02 <0.01 <0.01 <0.01 0.01 <0.01 0.02 0.01 0.01
Fe2O3 wt. % 0.99 2.10 3.42 0.70 <0.01 0.50 2.44 1.71 1.98 0.94 2.12 2.00 1.27 1.43 2.09 1.81 2.49 2.00 3.59 2.51 1.34 2.03 1.91 1.87
Total wt. % 99.72 100.25 100.88 99.68 98.66 99.63 99.68 99.45 99.62 99.21 99.15 99.47 99.52 99.88 99.41 98.86 99.40 98.65 99.00 99.62 98.83 100.18 99.65 99.84
Na * 0.02 0.02 0.02 0.02 0.01 0.01 0.02 0.02 0.02 0.02 0.03 0.02 0.02 0.02 0.02 0.03 0.03 0.02 0.02 0.03 0.02 0.03 0.02 0.02
K * <0.01 <0.01 <0.01 <0.01 <0.01 <0.01 <0.01 <0.01 <0.01 <0.01 <0.01 <0.01 <0.01 <0.01 <0.01 <0.01 <0.01 <0.01 <0.01 <0.01 <0.01 <0.01 <0.01 <0.01
Al * 0.08 0.08 0.08 0.07 0.08 0.08 0.08 0.08 0.08 0.08 0.09 0.09 0.08 0.07 0.08 0.10 0.11 0.12 0.08 0.10 0.12 0.12 0.11 0.11
Mg * 0.83 0.84 0.89 0.89 0.93 0.92 0.87 0.80 0.80 0.80 0.76 0.78 0.78 0.79 0.78 0.76 0.76 0.75 0.85 0.80 0.77 0.75 0.76 0.74
Si * 1.95 1.94 1.91 1.95 1.96 1.95 1.93 1.94 1.94 1.95 1.93 1.93 1.94 1.94 1.93 1.93 1.92 1.91 1.91 1.92 1.92 1.92 1.92 1.92
Ca * 0.88 0.86 0.83 0.70 0.61 0.69 0.76 0.86 0.88 0.87 0.89 0.83 0.85 0.83 0.85 0.82 0.87 0.82 0.83 0.75 0.77 0.83 0.86 0.85
Mn * 0.01 0.01 0.01 0.01 0.01 0.01 0.01 0.01 0.01 0.01 0.01 0.01 0.01 0.01 0.01 0.01 0.01 0.01 0.01 0.01 0.01 0.01 0.01 0.01
Ti * 0.01 0.01 0.01 0.01 0.01 0.01 0.01 0.01 0.01 0.01 0.01 0.01 0.01 0.01 0.01 0.01 0.01 0.01 0.01 0.01 0.01 0.01 0.01 0.01
Fe * 0.20 0.20 0.16 0.33 0.39 0.32 0.26 0.23 0.21 0.24 0.23 0.27 0.28 0.28 0.26 0.29 0.24 0.30 0.20 0.31 0.35 0.29 0.26 0.29
Ni * <0.01 <0.01 <0.01 <0.01 <0.01 <0.01 <0.01 <0.01 <0.01 <0.01 <0.01 <0.01 <0.01 <0.01 <0.01 <0.01 <0.01 <0.01 <0.01 <0.01 <0.01 <0.01 <0.01 <0.01
Cr * <0.01 <0.01 <0.01 <0.01 <0.01 <0.01 <0.01 <0.01 <0.01 <0.01 <0.01 <0.01 <0.01 <0.01 <0.01 <0.01 <0.01 <0.01 <0.01 <0.01 <0.01 <0.01 <0.01 <0.01
Fe3+ * 0.03 0.06 0.09 0.02 <0.01 0.01 0.07 0.05 0.06 0.03 0.06 0.06 0.04 0.04 0.06 0.05 0.07 0.06 0.10 0.07 0.04 0.06 0.05 0.05
Total *
WO % 45.74 45.22 44.00 36.27 31.45 35.78 40.16 45.05 46.29 45.24 47.09 43.81 44.46 43.55 44.63 43.70 46.29 43.47 44.28 40.03 40.76 44.13 45.67 44.87
EN % 43.48 44.13 47.13 46.30 48.15 47.48 45.77 42.28 42.23 41.75 40.28 41.45 40.65 41.20 41.39 40.42 40.39 40.02 44.93 42.88 40.54 40.01 40.14 39.44
FS % 10.78 10.66 8.88 17.43 20.41 16.74 14.07 12.67 11.48 13.01 12.63 14.74 14.89 15.24 13.98 15.88 13.32 16.51 10.79 17.10 18.70 15.86 14.19 15.69
SC18 SC19 SC19 SC19 SC19 SC19 SC19 SC19 SC20 SC20 SC20 SC20 SC20 SC21 SC21 SC21 SC21 SC21 SC25 SC25 SC25 SC25 SC26 SC26
OPX1.1 CPX1.1 CPX1.2 CPX2.1 CPX2.2 CPX2.3 CPX3.1 CPX3.2 CPX1.1 CPX1.2 CPX1.3 CPX2.1 CPX2.2 CPX1.2 CPX1.1 CPX2.1 CPX2.2 CPX3.1 CPX3.1 CPX3.2 CPX3.3 CPX4.1 CPX2.1 CPX1.2
Location (m) 1565.0 1670.0 1670.0 1670.0 1670.0 1670.0 1670.0 1670.0 1748.0 1748.0 1748.0 1748.0 1748.0 1800.0 1800.0 1800.0 1800.0 1800.0 2171.0 2171.0 2171.0 2171.0 2278.0 2278.0
Na2O wt. % 0.35 0.31 0.26 0.28 0.26 0.26 0.29 0.30 0.26 0.26 0.28 0.30 0.27 0.32 0.33 0.31 0.37 0.30 0.39 0.31 0.28 0.33 0.35 0.34
K2O wt. % <0.01 <0.01 <0.01 0.01 <0.01 <0.01 <0.01 <0.01 0.02 0.01 <0.01 0.01 0.01 <0.01 <0.01 <0.01 <0.01 <0.01 0.01 <0.01 0.01 0.01 <0.01 0.01
Al2O3 wt. % 2.53 1.71 1.70 1.93 1.94 1.80 1.85 1.70 1.90 1.87 1.93 1.71 1.83 1.84 2.01 1.87 1.96 1.74 2.31 2.05 1.84 2.10 1.99 2.03
MgO wt. % 14.43 14.76 14.05 14.14 14.27 14.42 15.10 16.11 14.32 14.09 14.12 14.31 14.19 16.20 14.52 14.60 14.07 15.02 13.19 14.26 15.53 14.04 14.72 14.69
SiO2 wt. % 50.70 52.49 52.31 52.09 52.28 52.26 51.91 52.32 52.16 52.52 51.84 51.97 51.68 52.38 52.74 52.42 52.19 52.31 51.26 51.80 51.88 52.13 52.04 52.05
CaO wt. % 19.68 21.77 21.89 21.82 19.66 20.11 21.33 20.51 19.10 20.10 20.87 20.71 20.40 19.56 20.70 20.90 21.88 19.57 21.47 19.25 17.68 20.03 18.82 17.91
MnO wt. % 0.27 0.25 0.25 0.25 0.21 0.23 0.29 0.31 0.23 0.21 0.21 0.24 0.20 0.20 0.16 0.16 0.16 0.19 0.25 0.22 0.28 0.23 0.15 0.15
TiO2 wt. % 0.34 0.36 0.38 0.40 0.39 0.37 0.36 0.31 0.31 0.30 0.36 0.30 0.29 0.34 0.38 0.38 0.41 0.36 0.47 0.56 0.46 0.49 0.35 0.35
FeO wt. % 8.077 7.176 8.353 7.927 9.854 9.711 6.475 6.133 11.104 10.44 8.863 8.691 9.143 7.27 8.844 8.607 7.784 9.434 8.597 10.697 10.442 10.262 9.773 10.189
NiO wt. % 0.02 0.02 0.01 0.01 0.03 0.03 0.03 0.04 0.04 0.01 0.05 0.02 0.03 0.02 0.06 0.04 0.02 0.04 0.01 0.02 0.04 0.03 0.04 0.04
Cr2O3 wt. % <0.01 0.03 0.07 0.06 0.06 0.08 0.10 0.06 0.04 0.06 0.04 0.04 0.06 0.17 0.22 0.21 0.24 0.20 0.21 0.24 0.25 0.33 0.49 0.38
Fe2O3 wt. % 3.29 1.81 0.70 1.08 <0.01 <0.01 3.12 3.89 <0.01 <0.01 1.07 1.09 0.79 2.17 <0.01 0.03 0.21 0.41 1.04 0.19 1.55 0.01 <0.01 <0.01
Total wt. % 99.69 100.67 99.96 100.00 98.95 99.27 100.85 101.66 99.47 99.89 99.63 99.39 98.88 100.49 99.98 99.51 99.29 99.56 99.19 99.59 100.24 99.98 98.72 98.14
Na * 0.03 0.02 0.02 0.02 0.02 0.02 0.02 0.02 0.02 0.02 0.02 0.02 0.02 0.02 0.02 0.02 0.03 0.02 0.03 0.02 0.02 0.02 0.03 0.03
K * <0.01 <0.01 <0.01 <0.01 <0.01 <0.01 <0.01 <0.01 <0.01 <0.01 <0.01 <0.01 <0.01 <0.01 <0.01 <0.01 <0.01 <0.01 <0.01 <0.01 <0.01 <0.01 <0.01 <0.01
Al * 0.11 0.07 0.08 0.09 0.09 0.08 0.08 0.07 0.08 0.08 0.09 0.08 0.08 0.08 0.09 0.08 0.09 0.08 0.10 0.09 0.08 0.09 0.09 0.09
Mg * 0.81 0.81 0.78 0.79 0.80 0.81 0.83 0.88 0.80 0.79 0.79 0.80 0.80 0.89 0.80 0.81 0.78 0.84 0.74 0.80 0.86 0.78 0.83 0.83
Si * 1.90 1.94 1.95 1.94 1.97 1.96 1.92 1.91 1.96 1.96 1.94 1.95 1.95 1.93 1.96 1.96 1.95 1.95 1.93 1.94 1.93 1.95 1.96 1.97
Ca * 0.79 0.86 0.87 0.87 0.79 0.81 0.84 0.80 0.77 0.81 0.84 0.83 0.82 0.77 0.82 0.84 0.88 0.78 0.87 0.77 0.71 0.80 0.76 0.73
Mn * 0.01 0.01 0.01 0.01 0.01 0.01 0.01 0.01 0.01 0.01 0.01 0.01 0.01 0.01 0.01 0.01 0.01 0.01 0.01 0.01 0.01 0.01 0.01 0.01
Ti * 0.01 0.01 0.01 0.01 0.01 0.01 0.01 0.01 0.01 0.01 0.01 0.01 0.01 0.01 0.01 0.01 0.01 0.01 0.01 0.02 0.01 0.01 0.01 0.01
Fe * 0.25 0.22 0.26 0.25 0.31 0.31 0.20 0.19 0.35 0.33 0.28 0.27 0.29 0.22 0.28 0.27 0.24 0.30 0.27 0.34 0.33 0.32 0.31 0.32
Ni * <0.01 <0.01 <0.01 <0.01 <0.01 <0.01 <0.01 <0.01 <0.01 <0.01 <0.01 <0.01 <0.01 <0.01 <0.01 <0.01 <0.01 <0.01 <0.01 <0.01 <0.01 <0.01 <0.01 <0.01
Cr * <0.01 <0.01 <0.01 <0.01 <0.01 <0.01 <0.01 <0.01 <0.01 <0.01 <0.01 <0.01 <0.01 0.01 0.01 0.01 0.01 0.01 0.01 0.01 0.01 0.01 0.02 0.01
Fe3+ * 0.09 0.05 0.02 0.03 <0.01 <0.01 0.09 0.11 <0.01 <0.01 0.03 0.03 0.02 0.06 <0.01 <0.01 0.01 0.01 0.03 0.01 0.04 <0.01 <0.01 <0.01
Total *
WO % 42.53 45.26 45.45 45.57 41.51 41.95 44.80 42.77 39.90 41.86 43.84 43.51 43.01 40.80 43.19 43.49 45.92 40.80 45.95 40.43 37.09 41.94 40.00 38.58
EN % 43.38 42.69 40.60 41.09 41.91 41.86 44.11 46.73 41.62 40.82 41.27 41.84 41.62 47.03 42.15 42.27 41.07 43.55 39.28 41.68 45.34 40.90 43.53 44.03
FS % 14.08 12.05 13.95 13.34 16.59 16.19 11.09 10.49 18.48 17.32 14.89 14.65 15.38 12.17 14.66 14.24 13.01 15.66 14.78 17.90 17.56 17.16 16.47 17.39
SE
RR
A D
O O
NÇ
A C
OM
PLE
X
Sample
Analysis
SE
RR
A D
O O
NÇ
A C
OM
PLE
X
Sample
Analysis
SE
RR
A D
O O
NÇ
A C
OM
PLE
X
Sample
Analysis

VI
SC33A SC33A SC33A SC33A SC33A SC33A SC33A SC34A SC34A SC34A SC34A SC34A SC34A SC35 SC35 SC35 SC35 SC35 SC43 SC43 SC43 SC43 SC43 SC43
CPX1.1 CPX1.2 CPX2.1 CPX2.2 CPX2.3 CPX3.1 CPX3.2 CPX1.1 CPX2.1 CPX2.2 CPX3.1 CPX3.2 CPX3.3 CPX3.1 CPX3.2 CPX3.3 CPX4.1 CPX4.2 CPX1.1 CPX2.1 CPX3.1 CPX3.2 CPX3.3 CPX4.1
Location (m) 2391.0 2391.0 2391.0 2391.0 2391.0 2391.0 2391.0 2254.0 2254.0 2254.0 2254.0 2254.0 2254.0 2210.0 2210.0 2210.0 2210.0 2210.0 1585.0 1585.0 1585.0 1585.0 1585.0 1585.0
Na2O wt. % 0.32 0.32 0.36 0.33 0.34 0.37 0.36 0.31 0.11 0.20 0.25 0.29 0.14 0.10 0.30 0.06 0.06 0.15 0.31 0.28 0.30 0.32 0.33 0.31
K2O wt. % 0.01 <0.01 <0.01 <0.01 0.01 <0.01 0.01 <0.01 0.01 <0.01 0.01 0.05 0.01 0.01 <0.01 <0.01 <0.01 <0.01 0.01 <0.01 0.01 0.01 <0.01 <0.01
Al2O3 wt. % 1.95 1.85 1.60 1.85 1.87 1.87 1.91 0.66 0.08 0.23 0.46 0.39 0.14 0.10 0.45 0.12 0.10 0.20 1.65 1.33 1.77 2.52 1.78 1.93
MgO wt. % 16.36 16.04 16.14 14.97 15.57 15.25 16.07 13.92 13.88 13.81 12.96 13.60 13.74 13.92 13.78 13.77 13.85 14.56 16.47 15.88 16.52 16.74 16.27 16.16
SiO2 wt. % 53.30 53.18 53.11 53.28 54.02 53.42 53.43 53.02 53.38 53.09 52.41 52.64 53.19 53.83 53.57 53.62 53.36 53.63 52.99 53.26 53.10 51.74 52.98 52.71
CaO wt. % 21.86 21.96 21.00 22.73 22.96 22.89 21.85 23.40 24.42 24.14 23.93 23.53 24.24 24.53 24.08 24.65 24.22 23.66 21.60 23.29 21.61 20.37 21.56 21.98
MnO wt. % 0.07 0.14 0.14 0.23 0.14 0.12 0.10 0.22 0.21 0.19 0.21 0.17 0.14 0.16 0.15 0.20 0.16 0.22 0.11 0.12 0.13 0.12 0.12 0.11
TiO2 wt. % 0.33 0.28 0.40 0.20 0.29 0.39 0.30 0.14 0.01 0.04 0.05 0.03 <0.01 <0.01 0.02 0.02 <0.01 0.01 0.27 0.25 0.27 0.24 0.39 0.25
FeO wt. % 5.218 5.436 6.355 6.029 5.734 5.468 5.673 7.082 7.062 6.818 7.485 6.893 7.221 7.248 7.139 7.316 7.333 6.819 4.982 4.312 4.979 4.459 5.397 4.7
NiO wt. % 0.04 0.04 0.06 0.01 <0.01 0.02 0.05 0.01 0.03 0.02 0.04 0.04 0.01 0.03 0.01 0.02 0.02 0.02 0.04 0.03 0.05 0.05 0.05 0.04
Cr2O3 wt. % 0.10 0.09 0.07 0.11 0.09 0.13 0.05 0.03 0.02 <0.01 0.02 0.03 0.03 0.03 0.05 0.03 0.04 0.05 0.09 0.13 0.11 0.06 0.09 0.10
Fe2O3 wt. % 0.29 0.62 0.25 <0.01 <0.01 <0.01 0.19 1.12 0.51 0.71 1.03 2.33 0.32 <0.01 0.30 <0.01 <0.01 <0.01 0.79 0.99 1.02 2.16 0.71 0.50
Total wt. % 99.86 99.96 99.46 99.73 101.02 99.92 99.99 99.90 99.72 99.26 98.85 99.99 99.18 99.96 99.83 99.81 99.13 99.32 99.30 99.87 99.87 98.79 99.68 98.79
Na * 0.02 0.02 0.03 0.02 0.02 0.03 0.03 0.02 0.01 0.02 0.02 0.02 0.01 0.01 0.02 0.01 <0.01 0.01 0.02 0.02 0.02 0.02 0.02 0.02
K * <0.01 <0.01 <0.01 <0.01 <0.01 <0.01 <0.01 <0.01 <0.01 <0.01 <0.01 <0.01 <0.01 <0.01 <0.01 <0.01 <0.01 <0.01 <0.01 <0.01 <0.01 <0.01 <0.01 <0.01
Al * 0.08 0.08 0.07 0.08 0.08 0.08 0.08 0.03 <0.01 0.01 0.02 0.02 0.01 <0.01 0.02 0.01 <0.01 0.01 0.07 0.06 0.08 0.11 0.08 0.08
Mg * 0.90 0.88 0.89 0.82 0.84 0.84 0.88 0.77 0.77 0.77 0.73 0.76 0.77 0.77 0.77 0.77 0.78 0.81 0.91 0.87 0.90 0.93 0.89 0.89
Si * 1.96 1.95 1.96 1.97 1.97 1.96 1.96 1.98 1.99 1.99 1.98 1.97 2.00 2.00 2.00 2.00 2.00 2.00 1.96 1.96 1.95 1.92 1.95 1.95
Ca * 0.86 0.87 0.83 0.90 0.90 0.90 0.86 0.94 0.98 0.97 0.97 0.94 0.98 0.98 0.96 0.99 0.97 0.95 0.85 0.92 0.85 0.81 0.85 0.87
Mn * <0.01 <0.01 <0.01 0.01 <0.01 <0.01 <0.01 0.01 0.01 0.01 0.01 0.01 0.01 0.01 0.01 0.01 0.01 0.01 <0.01 <0.01 <0.01 <0.01 <0.01 <0.01
Ti * 0.01 0.01 0.01 0.01 0.01 0.01 0.01 <0.01 <0.01 <0.01 <0.01 <0.01 <0.01 <0.01 <0.01 <0.01 <0.01 <0.01 0.01 0.01 0.01 0.01 0.01 0.01
Fe * 0.16 0.17 0.20 0.19 0.17 0.17 0.17 0.22 0.22 0.21 0.24 0.22 0.23 0.23 0.22 0.23 0.23 0.21 0.15 0.13 0.15 0.14 0.17 0.15
Ni * <0.01 <0.01 <0.01 <0.01 <0.01 <0.01 <0.01 <0.01 <0.01 <0.01 <0.01 <0.01 <0.01 <0.01 <0.01 <0.01 <0.01 <0.01 <0.01 <0.01 <0.01 <0.01 <0.01 <0.01
Cr * <0.01 <0.01 <0.01 <0.01 <0.01 <0.01 <0.01 <0.01 <0.01 <0.01 <0.01 <0.01 <0.01 <0.01 <0.01 <0.01 <0.01 <0.01 <0.01 <0.01 <0.01 <0.01 <0.01 <0.01
Fe3+ * 0.01 0.02 0.01 <0.01 <0.01 <0.01 0.01 0.03 0.01 0.02 0.03 0.07 0.01 <0.01 0.01 <0.01 <0.01 <0.01 0.02 0.03 0.03 0.06 0.02 0.01
Total * 3.99 3.99 3.99 3.99 3.99 3.99 3.99 4.00 3.99 4.00 4.00 4.00 4.00 3.99 4.00 4.00 3.99 4.00 3.99 3.99 3.99 3.99 3.99 3.99
WO % 44.88 45.29 43.37 47.09 46.79 47.32 44.93 48.45 49.57 49.59 50.05 49.19 49.47 49.49 49.33 49.80 49.22 48.04 44.62 47.76 44.57 43.25 44.55 45.66
EN % 46.76 45.97 46.40 43.16 44.12 43.86 45.97 40.10 39.22 39.47 37.72 39.54 39.02 39.07 39.27 38.68 39.16 41.14 47.34 45.32 47.40 49.39 46.75 46.71
FS % 8.36 8.74 10.23 9.74 9.10 8.81 9.10 11.45 11.21 10.94 12.23 11.27 11.52 11.44 11.40 11.53 11.62 10.82 8.05 6.92 8.02 7.37 8.69 7.64
SC44 SC44 SC44 SC44 SC44 SC44 SC44 SC33B SC33B SC33B SC33B SC34B SC34B SC34B SC34B SC34B SC34B SC34B SC36 SC36 SC36 SC36 SC36 SC36
CPX1.1 CPX1.2 CPX2.1 CPX2.2 CPX3.1 CPX3.2 CPX4.1 CPX1.1 CPX1.2 CPX2.1 CPX2.2 CPX1.1 CPX1.2 CPX1.3 CPX2.1 CPX2.2 CPX3.1 CPX3.2 CPX1.1 CPX1.2 CPX1.3 CPX2.1 CPX2.2 CPX2.3
Location (m) 1526.0 1526.0 1526.0 1526.0 1526.0 1526.0 1526.0 2391.0 2391.0 2391.0 2391.0 2254.0 2254.0 2254.0 2254.0 2254.0 2254.0 2254.0 2130.0 2130.0 2130.0 2130.0 2130.0 2130.0
Na2O wt. % 0.28 0.27 0.30 0.35 0.27 0.27 0.26 0.39 0.41 0.37 0.39 0.39 0.36 0.40 0.37 0.41 0.09 0.48 0.33 0.37 0.32 0.35 0.35 0.36
K2O wt. % 0.01 0.02 <0.01 0.08 <0.01 <0.01 <0.01 0.02 0.02 <0.01 <0.01 <0.01 <0.01 0.01 0.01 <0.01 0.07 0.01 0.01 <0.01 <0.01 0.01 <0.01 0.01
Al2O3 wt. % 1.91 1.89 1.72 2.23 2.02 1.91 1.75 2.13 2.67 2.55 2.37 3.63 2.11 2.11 2.56 3.46 0.82 1.88 2.86 2.73 2.81 3.00 3.11 3.01
MgO wt. % 17.75 17.44 17.21 17.60 17.24 17.20 17.34 17.18 16.77 17.02 17.08 15.84 16.78 16.83 16.28 15.42 16.28 15.56 16.35 16.29 16.36 16.12 16.34 16.35
SiO2 wt. % 53.12 53.15 52.88 53.21 53.57 53.40 53.43 53.09 52.32 53.11 52.98 51.72 53.10 53.05 51.79 51.17 53.55 52.98 52.14 52.07 52.23 51.77 51.32 52.59
CaO wt. % 20.70 21.13 20.90 19.81 21.01 21.26 21.15 21.47 21.40 21.60 21.48 20.48 20.92 21.07 20.63 20.87 24.09 22.42 21.40 21.01 21.38 21.07 20.66 21.36
MnO wt. % 0.11 0.10 0.10 0.13 0.11 0.10 0.09 0.09 0.09 0.11 0.08 0.14 0.13 0.13 0.12 0.14 0.14 0.15 0.10 0.14 0.09 0.09 0.16 0.09
TiO2 wt. % 0.25 0.25 0.26 0.25 0.25 0.24 0.22 0.24 0.25 0.24 0.22 0.33 0.22 0.20 0.30 0.32 0.15 0.30 0.25 0.29 0.28 0.26 0.28 0.28
FeO wt. % 4.123 4.156 4.472 5.048 5.252 4.814 4.671 3.577 3.391 3.81 3.599 5.716 5.142 4.57 4.864 5.132 3.372 4.724 4.351 4.67 4.53 4.611 4.206 4.824
NiO wt. % 0.05 0.05 0.06 0.06 0.04 0.03 0.07 0.05 0.05 0.08 0.08 0.05 0.02 0.05 0.05 0.08 0.03 0.03 0.03 0.05 0.04 0.04 0.04 0.02
Cr2O3 wt. % 0.06 0.01 0.06 0.11 0.03 0.06 0.10 1.19 1.32 1.39 1.20 1.35 0.74 0.77 0.93 1.25 0.23 0.70 1.04 1.06 1.13 1.17 1.16 1.12
Fe2O3 wt. % 1.14 1.17 1.18 0.05 0.09 0.46 0.71 0.47 0.91 0.30 0.53 0.34 0.50 1.09 1.08 0.91 <0.01 0.69 1.05 1.12 0.85 0.69 1.16 0.67
Total wt. % 99.49 99.65 99.14 98.93 99.87 99.73 99.79 99.89 99.60 100.57 100.00 99.98 100.02 100.26 98.98 99.15 98.83 99.91 99.90 99.81 100.01 99.18 98.79 100.69
Na * 0.02 0.02 0.02 0.03 0.02 0.02 0.02 0.03 0.03 0.03 0.03 0.03 0.03 0.03 0.03 0.03 0.01 0.04 0.02 0.03 0.02 0.03 0.03 0.03
K * <0.01 <0.01 <0.01 <0.01 <0.01 <0.01 <0.01 <0.01 <0.01 <0.01 <0.01 <0.01 <0.01 <0.01 <0.01 <0.01 <0.01 <0.01 <0.01 <0.01 <0.01 <0.01 <0.01 <0.01
Al * 0.08 0.08 0.08 0.10 0.09 0.08 0.08 0.09 0.12 0.11 0.10 0.16 0.09 0.09 0.11 0.15 0.04 0.08 0.12 0.12 0.12 0.13 0.14 0.13
Mg * 0.97 0.95 0.95 0.97 0.94 0.94 0.95 0.94 0.92 0.92 0.93 0.87 0.92 0.92 0.90 0.85 0.90 0.85 0.89 0.89 0.89 0.89 0.90 0.89
Si * 1.95 1.95 1.95 1.96 1.96 1.96 1.96 1.94 1.92 1.93 1.93 1.90 1.94 1.94 1.92 1.90 1.98 1.95 1.91 1.92 1.92 1.91 1.90 1.92
Ca * 0.81 0.83 0.83 0.78 0.82 0.83 0.83 0.84 0.84 0.84 0.84 0.81 0.82 0.82 0.82 0.83 0.96 0.88 0.84 0.83 0.84 0.83 0.82 0.83
Mn * <0.01 <0.01 <0.01 <0.01 <0.01 <0.01 <0.01 <0.01 <0.01 <0.01 <0.01 <0.01 <0.01 <0.01 <0.01 0.01 <0.01 0.01 <0.01 <0.01 <0.01 <0.01 0.01 <0.01
Ti * 0.01 0.01 0.01 0.01 0.01 0.01 0.01 0.01 0.01 0.01 0.01 0.01 0.01 0.01 0.01 0.01 <0.01 0.01 0.01 0.01 0.01 0.01 0.01 0.01
Fe * 0.13 0.13 0.14 0.16 0.16 0.15 0.14 0.11 0.10 0.12 0.11 0.18 0.16 0.14 0.15 0.16 0.10 0.15 0.13 0.14 0.14 0.14 0.13 0.15
Ni * <0.01 <0.01 <0.01 <0.01 <0.01 <0.01 <0.01 <0.01 <0.01 <0.01 <0.01 <0.01 <0.01 <0.01 <0.01 <0.01 <0.01 <0.01 <0.01 <0.01 <0.01 <0.01 <0.01 <0.01
Cr * <0.01 <0.01 <0.01 <0.01 <0.01 <0.01 <0.01 0.03 0.04 0.04 0.04 0.04 0.02 0.02 0.03 0.04 0.01 0.02 0.03 0.03 0.03 0.03 0.03 0.03
Fe3+ * 0.03 0.03 0.03 <0.01 <0.01 0.01 0.02 0.01 0.03 0.01 0.02 0.01 0.01 0.03 0.03 0.03 <0.01 0.02 0.03 0.03 0.02 0.02 0.03 0.02
Total * 3.99 3.99 3.99 3.99 3.99 4.00 3.99 3.99 3.99 4.00 4.00 4.00 4.00 3.99 3.99 4.00 3.99 4.00 4.00 3.99 4.00 4.00 4.00 4.00
WO % 42.58 43.45 43.24 41.08 42.80 43.46 43.22 44.59 45.19 44.75 44.70 43.60 43.35 43.83 43.83 45.06 48.80 46.97 45.00 44.40 44.85 44.72 44.28 44.62
EN % 50.81 49.90 49.53 50.76 48.83 48.88 49.32 49.63 49.22 49.07 49.44 46.89 48.36 48.72 48.10 46.31 45.89 45.32 47.83 47.88 47.73 47.61 48.71 47.51
FS % 6.61 6.66 7.23 8.15 8.37 7.66 7.46 5.79 5.59 6.18 5.85 9.51 8.29 7.45 8.07 8.63 5.31 7.70 7.17 7.72 7.42 7.67 7.01 7.87
SC38 SC38 SC38 SC38 SC38 SC38 SC38 SC39 SC39 SC39 SC39 SC39 SC39 SC40A SC40A SC40A SC40A SC40A SC40A SC40A SC40A SC41 SC41 SC41
CPX1.1 CPX1.2 CPX2.3 CPX2.4 CPX2.5 CPX3.1 CPX3.2 CPX1.1 CPX1.2 CPX2.1 CPX2.2 CPX2.3 CPX3.1 CPX2.1 CPX2.3 CPX2.2 CPX2.4 CPX1.1 CPX1.2 CPX1.3 CPX1.4 CPX1.1 CPX1.2 CPX1.3
Location (m) 2029.0 2029.0 2029.0 2029.0 2029.0 2029.0 2029.0 1998.0 1998.0 1998.0 1998.0 1998.0 1998.0 1930.0 1930.0 1930.0 1930.0 1930.0 1930.0 1930.0 1930.0 1850.0 1850.0 1850.0
Na2O wt. % 0.41 0.35 0.42 0.06 0.46 0.37 0.39 0.41 0.44 0.35 0.33 0.37 0.35 0.32 0.39 0.35 0.34 0.37 0.38 0.43 0.42 0.38 0.45 0.35
K2O wt. % 0.02 0.01 0.01 0.02 0.02 0.01 0.01 <0.01 <0.01 0.01 <0.01 <0.01 0.01 0.01 0.01 <0.01 0.01 0.01 0.01 <0.01 <0.01 <0.01 0.01 <0.01
Al2O3 wt. % 2.74 2.91 2.47 0.34 2.79 2.67 2.70 2.26 2.45 2.76 2.85 2.80 2.70 2.93 2.74 2.79 2.88 2.59 2.73 2.19 2.41 2.84 3.01 2.90
MgO wt. % 15.70 15.94 15.61 17.61 15.53 16.44 16.55 17.14 16.34 16.20 16.36 16.21 16.23 16.56 16.40 16.22 16.01 16.36 16.55 16.04 15.87 16.04 16.12 16.34
SiO2 wt. % 52.59 51.96 51.81 55.19 52.14 52.54 52.24 52.99 52.83 52.33 52.58 52.60 52.31 52.64 52.69 52.63 52.44 52.22 52.94 53.42 52.85 52.07 51.98 53.09
CaO wt. % 22.61 21.52 21.70 25.44 22.10 20.23 20.82 19.26 20.70 20.99 20.96 21.39 20.75 21.53 20.84 21.29 21.43 20.88 21.11 22.21 21.83 21.21 21.09 21.16
MnO wt. % 0.12 0.08 0.13 0.10 0.11 0.10 0.13 0.13 0.12 0.13 0.13 0.11 0.11 0.08 0.15 0.11 0.11 0.14 0.14 0.17 0.15 0.11 0.11 0.10
TiO2 wt. % 0.28 0.26 0.51 0.07 0.30 0.30 0.32 0.48 0.42 0.30 0.27 0.25 0.33 0.23 0.31 0.28 0.25 0.32 0.31 0.57 0.42 0.27 0.26 0.24
FeO wt. % 4.068 4.675 4.647 1.661 4.293 5.716 4.543 6.391 5.7 5.277 5.331 4.961 5.558 4.387 5.322 5.243 5.168 4.923 5.124 5.106 5.161 4.859 4.355 5.166
NiO wt. % 0.05 <0.01 0.03 <0.01 0.04 0.07 0.06 0.04 0.06 0.02 0.04 0.03 0.04 0.05 0.05 0.04 0.05 0.01 0.04 0.03 0.04 0.03 0.04 0.02
Cr2O3 wt. % 1.08 1.02 0.95 0.03 0.76 0.99 1.00 0.91 0.88 1.03 1.05 1.03 1.03 1.07 1.02 0.91 1.04 1.04 0.97 0.80 1.01 1.13 1.12 1.07
Fe2O3 wt. % 1.23 0.61 1.13 0.51 0.57 <0.01 1.49 <0.01 <0.01 0.31 <0.01 0.55 0.22 0.93 0.19 <0.01 0.19 0.76 0.61 <0.01 0.29 0.09 1.01 <0.01
Total wt. % 100.89 99.33 99.41 101.03 99.09 99.42 100.24 100.01 99.92 99.69 99.89 100.31 99.62 100.74 100.11 99.85 99.92 99.63 100.90 100.95 100.45 99.01 99.56 100.44
Na * 0.03 0.03 0.03 <0.01 0.03 0.03 0.03 0.03 0.03 0.03 0.02 0.03 0.03 0.02 0.03 0.03 0.02 0.03 0.03 0.03 0.03 0.03 0.03 0.03
K * <0.01 <0.01 <0.01 <0.01 <0.01 <0.01 <0.01 <0.01 <0.01 <0.01 <0.01 <0.01 <0.01 <0.01 <0.01 <0.01 <0.01 <0.01 <0.01 <0.01 <0.01 <0.01 <0.01 <0.01
Al * 0.12 0.13 0.11 0.02 0.12 0.12 0.12 0.10 0.11 0.12 0.12 0.12 0.12 0.13 0.12 0.12 0.13 0.11 0.12 0.09 0.10 0.12 0.13 0.12
Mg * 0.85 0.88 0.86 0.94 0.86 0.90 0.90 0.94 0.89 0.89 0.89 0.88 0.89 0.90 0.90 0.89 0.88 0.90 0.90 0.87 0.87 0.89 0.89 0.89
Si * 1.92 1.92 1.92 1.99 1.93 1.94 1.91 1.94 1.94 1.93 1.93 1.92 1.93 1.91 1.93 1.93 1.93 1.92 1.92 1.94 1.93 1.93 1.91 1.93
Ca * 0.88 0.85 0.86 0.98 0.88 0.80 0.82 0.76 0.81 0.83 0.82 0.84 0.82 0.84 0.82 0.84 0.84 0.82 0.82 0.87 0.86 0.84 0.83 0.83
Mn * <0.01 <0.01 <0.01 <0.01 <0.01 <0.01 <0.01 <0.01 <0.01 <0.01 <0.01 <0.01 <0.01 <0.01 0.01 <0.01 <0.01 <0.01 <0.01 0.01 0.01 <0.01 <0.01 <0.01
Ti * 0.01 0.01 0.01 <0.01 0.01 0.01 0.01 0.01 0.01 0.01 0.01 0.01 0.01 0.01 0.01 0.01 0.01 0.01 0.01 0.02 0.01 0.01 0.01 0.01
Fe * 0.12 0.14 0.14 0.05 0.13 0.18 0.14 0.20 0.18 0.16 0.16 0.15 0.17 0.13 0.16 0.16 0.16 0.15 0.16 0.16 0.16 0.15 0.13 0.16
Ni * <0.01 <0.01 <0.01 <0.01 <0.01 <0.01 <0.01 <0.01 <0.01 <0.01 <0.01 <0.01 <0.01 <0.01 <0.01 <0.01 <0.01 <0.01 <0.01 <0.01 <0.01 <0.01 <0.01 <0.01
Cr * 0.03 0.03 0.03 <0.01 0.02 0.03 0.03 0.03 0.03 0.03 0.03 0.03 0.03 0.03 0.03 0.03 0.03 0.03 0.03 0.02 0.03 0.03 3.00 0.03
Fe3+ * 0.03 0.02 0.03 0.01 0.02 <0.01 0.04 <0.01 <0.01 0.01 <0.01 0.02 0.01 0.03 0.01 <0.01 0.01 0.02 0.02 <0.01 0.01 <0.01 0.03 <0.01
Total * 4.00 4.00 4.00 3.99 3.99 3.99 3.99 3.99 4.00 4.00 3.99 4.00 4.00 4.00 4.00 4.00 3.99 4.00 4.00 4.00 4.00 3.99 6.96 3.99
WO % 47.50 45.49 46.14 49.67 46.97 42.51 43.95 40.06 43.23 44.07 43.75 44.74 43.54 44.87 43.57 44.40 44.89 43.97 43.86 45.79 45.56 44.83 44.95 44.17
EN % 45.83 46.82 46.14 47.80 45.90 48.11 48.57 49.55 47.48 47.31 47.53 47.14 47.37 48.02 47.73 47.06 46.65 47.92 47.81 46.00 46.04 47.17 47.81 47.43
FS % 6.67 7.69 7.72 2.53 7.13 9.38 7.48 10.39 9.29 8.62 8.72 8.12 9.09 7.11 8.69 8.54 8.47 8.11 8.32 8.21 8.41 8.00 7.24 8.40
SC45 SC45 SC45 SC45 SC45 SC45 SC46 SC46 SC46 SC46 SC46 SC46 SC47A SC47A SC47A SC47A SC47A SC47A SC47A SC47A SC47B SC47B SC47B SC47B
CPX1.1 CPX1.2 CPX2.1 CPX2.2 CPX3.1 CPX3.2 CPX1.1 CPX1.2 CPX1.3 CPX1.4 CPX2.1 CPX2.2 CPX1.1 CPX1.2 CPX2.1 CPX2.2 CPX3.1 CPX3.2 CPX4.1 CPX4.2 CPX1.1 CPX2.1 CPX2.2 CPX3.1
Location (m) 1473.0 1473.0 1473.0 1473.0 1473.0 1473.0 1213.0 1213.0 1213.0 1213.0 1213.0 1213.0 1184.0 1184.0 1184.0 1184.0 1184.0 1184.0 1184.0 1184.0 1184.0 1184.0 1184.0 1184.0
Na2O wt. % 0.29 0.30 0.30 0.32 0.31 0.25 0.27 0.35 0.36 0.36 0.33 0.38 0.29 0.29 0.27 0.27 0.25 0.26 0.28 0.31 0.25 0.25 0.27 0.28
K2O wt. % <0.01 <0.01 <0.01 <0.01 <0.01 <0.01 <0.01 0.01 0.01 <0.01 <0.01 <0.01 0.01 <0.01 0.01 0.01 0.01 0.01 0.01 0.01 0.01 0.01 0.01 0.02
Al2O3 wt. % 1.94 1.91 1.68 1.78 1.97 1.93 1.68 2.16 1.89 2.23 2.44 1.76 1.71 2.05 2.15 2.00 1.89 1.93 1.96 2.15 1.87 1.82 1.87 2.16
MgO wt. % 17.17 17.33 16.93 16.38 16.86 17.54 17.80 16.94 16.90 16.65 17.21 17.67 17.30 17.57 17.71 17.70 17.53 17.81 17.86 17.44 17.47 18.09 17.89 17.94
SiO2 wt. % 53.87 53.97 53.73 53.80 53.77 53.81 53.45 53.41 53.86 53.45 53.94 54.43 54.22 53.67 53.92 53.84 54.06 54.20 54.10 53.68 52.89 53.34 53.89 53.56
CaO wt. % 20.77 21.14 20.78 22.06 21.49 20.84 20.66 21.48 21.73 21.90 21.21 20.19 21.39 20.89 20.86 21.30 21.02 21.07 21.05 21.14 20.97 21.21 20.89 20.79
MnO wt. % 0.12 0.11 0.13 0.12 0.13 0.12 0.13 0.11 0.11 0.09 0.07 0.11 0.13 0.11 0.11 0.08 0.12 0.12 0.10 0.09 0.06 0.10 0.10 0.06
TiO2 wt. % 0.26 0.24 0.42 0.40 0.27 0.21 0.24 0.23 0.27 0.31 0.33 0.33 0.18 0.25 0.25 0.11 0.16 0.15 0.14 0.27 0.14 0.21 0.15 0.19
FeO wt. % 5.545 5.2 5.963 5.345 5.337 5.259 4.543 4.569 4.8 4.623 5.025 5.379 4.446 4.719 4.407 4.279 4.4 4.388 4.384 4.346 3.3 3.207 3.831 3.831
NiO wt. % 0.02 0.06 0.03 0.05 0.04 0.05 0.03 0.04 0.06 0.06 0.01 0.06 0.06 0.06 0.04 0.02 0.03 0.05 0.03 0.05 0.07 0.03 0.03 0.07
Cr2O3 wt. % 0.22 0.19 0.18 0.20 0.20 0.25 0.18 0.40 0.38 0.31 0.21 0.39 0.25 0.23 0.24 0.27 0.26 0.28 0.29 0.22 0.19 0.15 0.17 0.23
Fe2O3 wt. % <0.01 0.05 <0.01 <0.01 0.06 <0.01 0.71 0.21 0.15 0.50 <0.01 <0.01 <0.01 <0.01 <0.01 0.01 <0.01 <0.01 <0.01 <0.01 <0.01 0.51 <0.01 <0.01
Total wt. % 100.20 100.51 100.15 100.45 100.44 100.24 99.70 99.91 100.53 100.48 100.78 100.70 99.97 99.82 99.95 99.88 99.74 100.27 100.20 99.71 97.21 98.93 99.09 99.14
Na * 0.02 0.02 0.02 0.02 0.02 0.02 0.02 0.03 0.03 0.03 0.02 0.03 0.02 0.02 0.02 0.02 0.02 0.02 0.02 0.02 0.02 0.02 0.02 0.02
K * <0.01 <0.01 <0.01 <0.01 <0.01 <0.01 <0.01 <0.01 <0.01 <0.01 <0.01 <0.01 <0.01 <0.01 <0.01 <0.01 <0.01 <0.01 <0.01 <0.01 <0.01 <0.01 <0.01 <0.01
Al * 0.08 0.08 0.07 0.08 0.08 0.08 0.07 0.09 0.08 0.10 0.10 0.08 0.07 0.09 0.09 0.09 0.08 0.08 0.08 0.09 0.08 0.08 0.08 0.09
Mg * 0.93 0.94 0.92 0.89 0.92 0.95 0.97 0.92 0.92 0.90 0.93 0.95 0.94 0.96 0.96 0.96 0.95 0.96 0.97 0.95 0.97 0.99 0.98 0.98
Si * 1.96 1.96 1.96 1.96 1.96 1.96 1.95 1.95 1.96 1.95 1.95 1.97 1.97 1.96 1.96 1.96 1.97 1.96 1.96 1.96 1.97 1.96 1.97 1.96
Ca * 0.81 0.82 0.81 0.86 0.84 0.81 0.81 0.84 0.85 0.85 0.82 0.78 0.83 0.82 0.81 0.83 0.82 0.82 0.82 0.83 0.84 0.83 0.82 0.81
Mn * <0.01 <0.01 <0.01 <0.01 <0.01 <0.01 <0.01 <0.01 <0.01 <0.01 <0.01 <0.01 <0.01 <0.01 <0.01 <0.01 <0.01 <0.01 <0.01 <0.01 <0.01 <0.01 <0.01 <0.01
Ti * 0.01 0.01 0.01 0.01 0.01 0.01 0.01 0.01 0.01 0.01 0.01 0.01 0.01 0.01 0.01 <0.01 <0.01 <0.01 <0.01 0.01 <0.01 0.01 <0.01 0.01
Fe * 0.17 0.16 0.18 0.16 0.16 0.16 0.14 0.14 0.15 0.14 0.15 0.16 0.14 0.14 0.13 0.13 0.13 0.13 0.13 0.13 0.10 0.10 0.12 0.70
Ni * <0.01 <0.01 <0.01 <0.01 <0.01 <0.01 <0.01 <0.01 <0.01 <0.01 <0.01 <0.01 <0.01 <0.01 <0.01 <0.01 <0.01 <0.01 <0.01 <0.01 <0.01 <0.01 <0.01 <0.01
Cr * 0.01 0.01 0.01 0.01 0.01 0.01 0.01 0.01 0.01 0.01 0.01 0.01 0.01 0.01 0.01 0.01 0.01 0.01 0.01 0.01 0.01 <0.01 0.01 0.01
Fe3+ * <0.01 <0.01 <0.01 <0.01 <0.01 <0.01 0.02 0.01 <0.01 0.01 <0.01 <0.01 <0.01 <0.01 <0.01 <0.01 <0.01 <0.01 <0.01 <0.01 <0.01 0.01 <0.01 <0.01
Total * 3.99 4.00 3.99 3.99 3.99 3.99 4.00 4.00 3.99 4.00 4.00 3.99 3.99 4.00 3.99 3.99 3.98 3.99 3.99 3.99 3.99 3.99 3.99 4.58
WO % 42.42 42.89 42.41 45.01 43.74 42.23 42.18 44.19 44.36 44.99 43.22 41.20 43.73 42.61 42.62 43.23 43.02 42.76 42.69 43.31 43.82 43.41 42.83 32.66
EN % 48.74 48.88 48.10 46.48 47.76 49.45 50.57 48.45 47.98 47.58 48.79 50.21 49.19 49.87 50.34 50.00 49.95 50.29 50.37 49.71 50.79 51.49 51.05 39.25
FS % 8.84 8.23 9.49 8.51 8.51 8.32 7.25 7.36 7.66 7.43 7.99 8.59 7.08 7.52 7.03 6.77 7.03 6.95 6.94 6.97 5.39 5.11 6.13 28.09
SC47B SC47B SC47B SC47B SC47B SC47B SC50 SC50 SC50 SC50 SC50 SC48 SC48 SC48 SC48 SC48 SC48 SC48 SC48
CPX3.2 CPX1.1 CPX3.2 CPX4.1 CPX4.2 CPX4.3 CPX1.1 CPX1.2 CPX1.3SC50CPX1.4 CPX1.5 CPX1.1 CPX1.2 CPX1.3 CPX2.1 CPX2.2 CPX1.1 CPX2.1 CPX3.1
Location (m) 1184.0 1184.0 1184.0 1184.0 1184.0 1184.0 790.0 790.0 790.0 790.0 790.0 1145.0 1145.0 1145.0 1145.0 1145.0 1145.0 1145.0 1145.0
Na2O wt. % 0.27 0.26 0.27 0.24 0.26 0.25 0.49 0.50 0.54 0.44 0.56 0.36 0.31 0.36 0.37 0.44 0.36 0.35 0.39
K2O wt. % 0.02 <0.01 0.01 <0.01 <0.01 0.01 0.01 <0.01 0.01 0.02 <0.01 0.01 <0.01 0.01 0.01 <0.01 0.01 <0.01 0.02
Al2O3 wt. % 1.90 1.79 1.88 1.86 1.91 1.83 2.43 2.35 2.66 2.46 2.25 2.19 2.06 2.17 2.19 2.17 2.10 2.25 2.58
MgO wt. % 18.48 18.40 17.94 17.84 18.00 18.12 17.23 17.84 16.43 17.25 16.94 17.14 19.34 17.68 17.45 17.61 17.84 17.13 16.56
SiO2 wt. % 53.86 54.51 54.51 54.52 54.69 54.46 51.87 53.16 52.26 52.95 52.89 53.14 53.71 53.47 54.04 53.31 53.61 53.42 53.28
CaO wt. % 19.59 21.19 21.67 21.00 21.41 21.10 20.17 20.37 21.66 20.58 21.60 21.34 18.63 20.77 20.26 19.31 20.44 20.74 21.48
MnO wt. % 0.09 0.09 0.11 0.12 0.09 0.09 0.08 0.08 0.06 0.09 0.08 0.11 0.10 0.13 0.11 0.11 0.11 0.10 0.10
TiO2 wt. % 0.16 0.17 0.11 0.15 0.13 0.17 0.38 0.36 0.40 0.36 0.41 0.16 0.16 0.20 0.16 0.26 0.15 0.19 0.21
FeO wt. % 3.872 4.049 3.916 4.46 4.038 4.157 3.369 3.529 3.163 3.561 3.008 3.922 4.413 4.123 4.57 5.084 4.364 4.413 4.266
NiO wt. % 0.04 0.06 0.01 0.05 0.08 0.06 0.07 0.06 0.06 0.02 0.05 0.07 0.06 0.03 0.08 0.04 0.07 0.08 0.03
Cr2O3 wt. % 0.16 0.19 0.15 0.19 0.18 0.16 1.30 1.22 1.31 1.19 1.26 1.14 1.17 1.20 1.17 1.07 1.21 1.15 1.13
Fe2O3 wt. % <0.01 0.11 <0.01 <0.01 <0.01 <0.01 0.31 0.01 0.27 <0.01 0.20 0.28 0.26 0.16 <0.01 <0.01 0.03 <0.01 <0.01
Total wt. % 98.44 100.82 100.57 100.44 100.79 100.42 97.71 99.47 98.82 98.92 99.24 99.85 100.20 100.30 100.43 99.41 100.31 99.83 100.05
Na * 0.02 0.02 0.02 0.02 0.02 0.02 0.04 0.04 0.04 0.03 0.04 0.03 0.02 0.03 0.03 0.03 0.03 0.03 0.03
K * <0.01 <0.01 <0.01 <0.01 <0.01 <0.01 <0.01 <0.01 <0.01 <0.01 <0.01 <0.01 <0.01 <0.01 <0.01 <0.01 <0.01 <0.01 <0.01
Al * 0.08 0.08 0.08 0.08 0.08 0.08 0.11 0.10 0.12 0.11 0.10 0.09 0.09 0.09 0.09 0.09 0.09 0.10 0.11
Mg * 1.01 0.99 0.97 0.96 0.97 0.98 0.96 0.97 0.90 0.94 0.93 0.93 1.04 0.96 0.94 0.96 0.97 0.93 0.90
Si * 1.98 1.96 1.97 1.97 1.97 1.97 1.93 1.94 1.93 1.94 1.94 1.94 1.94 1.94 1.96 1.95 1.95 1.95 1.94
Ca * 0.77 0.82 0.84 0.81 0.83 0.82 0.80 0.80 0.86 0.81 0.85 0.84 0.72 0.81 0.79 0.76 0.80 0.81 0.84
Mn * <0.01 <0.01 <0.01 <0.01 <0.01 <0.01 <0.01 <0.01 <0.01 <0.01 <0.01 <0.01 <0.01 <0.01 <0.01 <0.01 <0.01 <0.01 <0.01
Ti * <0.01 0.01 <0.01 <0.01 <0.01 0.01 0.01 0.01 0.01 0.01 0.01 <0.01 <0.01 0.01 <0.01 0.01 <0.01 0.01 0.01
Fe * 0.12 0.12 0.12 0.14 0.12 0.13 0.11 0.11 0.10 0.11 0.09 0.12 0.13 0.13 0.14 0.16 0.13 0.14 0.13
Ni * <0.01 <0.01 <0.01 <0.01 <0.01 <0.01 <0.01 <0.01 <0.01 <0.01 <0.01 <0.01 <0.01 <0.01 <0.01 <0.01 <0.01 <0.01 <0.01
Cr * 0.01 0.01 <0.01 0.01 0.01 <0.01 0.04 0.04 0.04 0.04 0.04 0.03 0.03 0.03 0.03 0.03 0.04 0.03 0.03
Fe3+ * <0.01 <0.01 <0.01 <0.01 <0.01 <0.01 0.01 <0.01 0.01 <0.01 0.01 0.01 0.01 <0.01 <0.01 <0.01 <0.01 <0.01 <0.01
Total * 3.98 3.99 3.99 3.98 3.99 3.99 4.00 4.00 4.00 3.99 4.00 3.99 3.99 3.99 3.98 3.99 3.99 3.99 3.99
WO % 40.55 42.42 43.62 42.59 43.16 42.57 43.11 42.48 46.10 43.45 45.47 44.23 38.04 42.75 42.12 40.43 42.02 43.18 44.89
EN % 53.19 51.25 50.23 50.34 50.47 50.86 51.26 51.76 48.63 50.70 49.60 49.42 54.95 50.63 50.48 51.25 51.00 49.63 48.15
FS % 6.27 6.33 6.14 7.07 6.37 6.57 5.63 5.76 5.28 5.85 4.93 6.36 7.01 6.61 7.40 8.32 6.98 7.19 6.96
SE
RR
A D
O P
UM
A C
OM
PLE
X
Sample
Analysis
SE
RR
A D
O P
UM
A C
OM
PLE
X
Sample
Analysis
SE
RR
A D
O P
UM
A C
OM
PLE
X
Sample
Analysis
SE
RR
A D
O P
UM
A C
OM
PLE
X
Sample
Analysis
SE
RR
A D
O P
UM
A C
OM
PLE
X
Sample
Analysis

VII
SC22 SC22 SC22 SC22 SC22 SC22 SC23 SC23 SC23 SC23 SC23 SC23 SC24A SC24A SC24A SC24A SC24A SC24A SC24A SC11 SC11 SC11 SC11 SC11
PL1.1 PL1.2 PL2.1 PL2.2 PL3.1 PL2.2 PL1.1 PL1.2 PL2.1 PL2.2 PL3.1 PL3.2 PL1.1 PL1.2 PL2.1 PL2.2 PL2.3 PL3.1 PL3.2 PL1.1 PL1.2 PL2.1 PL2.2 PL3.1
Location (m) 1898.0 1898.0 1898.0 1898.0 1898.0 1898.0 1987.0 1987.0 1987.0 1987.0 1987.0 1987.0 2081.0 2081.0 2081.0 2081.0 2081.0 2081.0 2081.0 1060.0 1060.0 1060.0 1060.0 1060.0
Na2O wt. % 5.41 5.00 4.83 4.92 4.97 5.01 4.36 4.42 4.58 4.88 4.63 4.43 4.81 4.60 4.57 4.13 4.65 4.98 5.40 4.14 4.31 4.26 4.16 4.20
K2O wt. % 0.26 0.25 0.26 0.26 0.19 0.23 0.25 0.20 0.24 0.27 0.27 0.25 0.23 0.26 0.29 0.24 0.25 0.27 0.35 0.08 0.06 0.07 0.07 0.07
SiO2 wt. % 54.64 54.05 53.38 53.51 53.44 53.75 53.40 53.10 53.87 53.81 53.11 53.09 53.77 53.63 52.88 52.58 53.23 54.02 54.24 51.60 52.25 51.67 51.69 52.14
Al2O3 wt. % 28.82 28.87 29.50 28.77 29.08 28.90 29.72 29.94 29.07 29.11 29.72 29.71 29.10 29.21 29.32 29.49 29.08 28.67 28.24 30.09 29.90 30.41 30.35 30.28
FeO wt. % 0.30 0.38 0.27 0.40 0.36 0.27 0.40 0.40 0.82 0.36 0.43 0.39 0.48 0.45 0.40 0.38 0.37 0.41 0.39 0.31 0.38 0.33 0.31 0.36
CaO wt. % 11.12 11.51 11.89 11.49 11.64 11.69 12.36 12.55 11.74 11.61 12.37 12.33 12.21 12.01 11.99 12.39 12.14 11.49 11.08 13.08 13.13 13.40 13.30 13.15
BaO wt. % 0.04 >0.01 0.13 >0.01 >0.01 0.09 >0.01 0.10 0.09 >0.01 >0.01 >0.01 0.03 >0.01 >0.01 >0.01 0.07 0.11 0.06 >0.01 >0.01 0.18 >0.01 >0.01
SrO wt. % >0.01 0.04 0.01 >0.01 0.01 >0.01 >0.01 >0.01 >0.01 0.05 >0.01 >0.01 >0.01 >0.01 0.05 >0.01 >0.01 >0.01 >0.01 >0.01 0.06 >0.01 >0.01 >0.01
Total wt. % 100.595 100.089 100.254 99.344 99.689 99.93 100.482 100.706 100.392 100.087 100.526 100.214 100.615 100.15 99.495 99.209 99.783 99.951 99.765 99.3 100.098 100.32 99.868 100.197
Na * 0.47 0.44 0.42 0.44 0.44 0.44 0.38 0.39 0.40 0.43 0.41 0.39 0.42 0.40 0.40 0.37 0.41 0.44 0.48 0.37 0.38 0.38 0.37 0.37
K * 0.02 0.01 0.02 0.02 0.01 0.01 0.01 0.01 0.01 0.02 0.02 0.02 0.01 0.02 0.02 0.01 0.01 0.02 0.02 0.01 >0.01 >0.01 >0.01 >0.01
Si * 2.46 2.45 2.42 2.44 2.43 2.44 2.41 2.40 2.44 2.44 2.40 2.40 2.43 2.43 2.41 2.40 2.42 2.45 2.46 2.36 2.38 2.35 2.36 2.37
Al * 1.53 1.54 1.57 1.55 1.56 1.55 1.58 1.59 1.55 1.55 1.58 1.59 1.55 1.56 1.58 1.59 1.56 1.53 1.51 1.62 1.60 1.63 1.63 1.62
Fe * 0.01 0.01 0.01 0.02 0.01 0.01 0.02 0.02 0.03 0.01 0.02 0.02 0.02 0.02 0.02 0.02 0.01 0.02 0.02 0.01 0.02 0.01 0.01 0.01
Ca * 0.54 0.56 0.58 0.56 0.57 0.57 0.60 0.61 0.57 0.56 0.60 0.60 0.59 0.58 0.59 0.61 0.59 0.56 0.54 0.64 0.64 0.65 0.65 0.64
Ba * >0.01 >0.01 >0.01 >0.01 >0.01 >0.01 >0.01 >0.01 >0.01 >0.01 >0.01 >0.01 >0.01 >0.01 >0.01 >0.01 >0.01 >0.01 >0.01 >0.01 >0.01 >0.01 >0.01 >0.01
Sr * >0.01 >0.01 >0.01 >0.01 >0.01 >0.01 >0.01 >0.01 >0.01 >0.01 >0.01 >0.01 >0.01 >0.01 >0.01 >0.01 >0.01 >0.01 >0.01 >0.01 >0.01 >0.01 >0.01 >0.01
Total * 5.02 5.01 5.02 5.01 5.02 5.02 5.00 5.01 5.00 5.01 5.02 5.01 5.02 5.00 5.01 4.99 5.01 5.01 5.03 5.01 5.02 5.03 5.02 5.01
AB % 46.15 43.36 41.74 43.03 43.08 43.10 38.41 38.49 40.77 42.55 39.75 38.84 41.07 40.32 40.14 37.09 40.35 43.26 45.95 36.23 37.16 36.37 36.02 36.49
OR % 1.47 1.40 1.45 1.47 1.11 1.31 1.42 1.13 1.39 1.57 1.52 1.46 1.31 1.48 1.66 1.43 1.40 1.54 1.96 0.45 0.33 0.37 0.38 0.40
AN. % 52.38 55.24 56.81 55.50 55.82 55.59 60.17 60.38 57.83 55.88 58.73 59.70 57.63 58.20 58.20 61.49 58.25 55.19 52.09 63.33 62.51 63.26 63.60 63.11
SC11 SC12 SC12 SC12 SC12 SC12 SC12 SC12 SC12 SC13 SC13 SC13 SC13 SC13 SC13 SC14 SC14 SC14 SC14 SC14 SC14 SC15 SC15 SC15
PL3.2 PL1.1 PL1.2 PL2.1 PL2.2 PL2.1 PL2.2 PL3.1 PL3.2 PL1.1 PL1.2 PL2.1 PL2.2 PL2.1 PL2.2 PL1.1 PL1.2 PL2.1 PL2.2 PL3.1 PL4.1 PL1.1 PL1.1 PL3.1
Location (m) 1060.0 1120.0 1120.0 1120.0 1120.0 1120.0 1120.0 1120.0 1120.0 1135.0 1135.0 1135.0 1135.0 1135.0 1135.0 1225.0 1225.0 1225.0 1225.0 1225.0 1225.0 1370.0 1370.0 1370.0
Na2O wt. % 4.16 4.58 4.81 4.24 4.57 4.60 4.52 4.22 4.49 5.25 5.07 4.69 4.60 4.79 4.78 4.87 4.73 4.96 5.31 5.03 4.71 4.77 4.71 4.76
K2O wt. % 0.07 0.22 0.23 0.22 0.20 0.19 0.21 0.25 0.20 0.13 0.18 0.13 0.11 0.11 0.09 0.19 0.16 0.10 0.16 0.14 0.16 0.27 0.27 0.22
SiO2 wt. % 51.75 52.85 53.25 52.73 52.58 53.49 53.15 52.46 52.68 54.33 53.95 53.28 52.47 53.08 52.85 52.88 52.87 53.36 54.24 53.75 53.19 53.43 52.82 52.89
Al2O3 wt. % 30.22 29.89 29.63 30.08 29.76 29.26 29.31 29.76 29.84 29.37 29.16 29.69 29.91 29.76 30.06 29.12 29.30 29.12 28.93 29.29 29.39 29.54 29.43 29.66
FeO wt. % 0.43 0.35 0.27 0.26 0.37 0.37 0.58 0.37 0.41 0.30 0.35 0.34 0.38 0.39 0.23 0.43 0.24 0.27 0.38 0.34 0.47 0.46 0.30 0.38
CaO wt. % 13.34 12.27 12.05 12.99 12.34 12.28 12.33 12.51 12.60 11.68 11.67 12.22 12.37 12.43 12.54 12.09 12.22 11.85 11.37 11.79 12.30 12.12 12.23 12.26
BaO wt. % 0.06 0.03 0.04 >0.01 0.01 >0.01 0.11 >0.01 0.06 0.06 >0.01 0.11 0.27 0.14 >0.01 >0.01 0.09 0.07 >0.01 0.11 0.09 >0.01 0.01 0.11
SrO wt. % >0.01 >0.01 0.05 0.02 0.01 >0.01 >0.01 >0.01 >0.01 0.03 >0.01 >0.01 >0.01 >0.01 >0.01 >0.01 >0.01 >0.01 >0.01 >0.01 >0.01 >0.01 >0.01 >0.01
Total wt. % 100.024 100.193 100.336 100.54 99.847 100.183 100.201 99.563 100.275 101.136 100.372 100.454 100.11 100.695 100.542 99.581 99.602 99.733 100.391 100.438 100.3 100.585 99.772 100.284
Na * 0.37 0.40 0.42 0.37 0.40 0.40 0.40 0.37 0.40 0.46 0.44 0.41 0.41 0.42 0.42 0.43 0.42 0.44 0.47 0.44 0.41 0.42 0.42 0.42
K * >0.01 0.01 0.01 0.01 0.01 0.01 0.01 0.01 0.01 0.01 0.01 0.01 0.01 0.01 0.01 0.01 0.01 0.01 0.01 0.01 0.01 0.02 0.02 0.01
Si * 2.36 2.39 2.41 2.38 2.39 2.42 2.41 2.39 2.39 2.43 2.44 2.41 2.39 2.40 2.39 2.41 2.41 2.43 2.45 2.43 2.41 2.41 2.40 2.40
Al * 1.62 1.60 1.58 1.60 1.60 1.56 1.57 1.60 1.59 1.55 1.55 1.58 1.60 1.58 1.60 1.57 1.57 1.56 1.54 1.56 1.57 1.57 1.58 1.59
Fe * 0.02 0.01 0.01 0.01 0.01 0.01 0.02 0.01 0.02 0.01 0.01 0.01 0.01 0.02 0.01 0.02 0.01 0.01 0.01 0.01 0.02 0.02 0.01 0.01
Ca * 0.65 0.60 0.58 0.63 0.60 0.60 0.60 0.61 0.61 0.56 0.56 0.59 0.60 0.60 0.61 0.59 0.60 0.58 0.55 0.57 0.60 0.59 0.60 0.60
Ba * >0.01 >0.01 >0.01 >0.01 >0.01 >0.01 >0.01 >0.01 >0.01 >0.01 >0.01 >0.01 0.01 >0.01 >0.01 >0.01 >0.01 >0.01 >0.01 >0.01 >0.01 >0.01 >0.01 >0.01
Sr * >0.01 >0.01 >0.01 >0.01 >0.01 >0.01 >0.01 >0.01 >0.01 >0.01 >0.01 >0.01 >0.01 >0.01 >0.01 >0.01 >0.01 >0.01 >0.01 >0.01 >0.01 >0.01 >0.01 >0.01
Total * 5.02 5.02 5.02 5.01 5.02 5.01 5.01 5.00 5.02 5.02 5.02 5.01 5.02 5.02 5.03 5.03 5.02 5.02 5.02 5.02 5.02 5.02 5.02 5.03
AB % 35.96 39.83 41.40 36.64 39.69 39.94 39.42 37.36 38.75 44.54 43.56 40.71 39.99 40.83 40.62 41.71 40.81 42.86 45.39 43.22 40.56 40.95 40.47 40.76
OR % 0.37 1.23 1.30 1.25 1.13 1.10 1.18 1.45 1.16 0.72 1.00 0.72 0.65 0.62 0.48 1.09 0.89 0.59 0.90 0.79 0.92 1.55 1.53 1.26
AN. % 63.68 58.94 57.30 62.12 59.18 58.96 59.40 61.19 60.09 54.74 55.44 58.58 59.37 58.55 58.90 57.20 58.29 56.55 53.70 55.99 58.52 57.50 58.00 57.98
SC15 SC15 SC15 SC16B SC16B SC16B SC16B SC16B SC16B SC17 SC17 SC17 SC17 SC17 SC17 SC18 SC18 SC18 SC18 SC18 SC18 SC18 SC19 SC19
PL3.2 PL4.1 PL4.2 PL1.1 PL1.2 PL2.1 PL2.2 PL3.1 PL3.2 PL1.1 PL1.2 PL2.1 PL2.2 PL3.1 PL3.2 PL1.2 PL1.3 PL2.1 PL3.1 PL4.1 PL4.2 PL5.1 PL1.1 PL1.2
Location (m) 1370.0 1370.0 1370.0 1445.0 1445.0 1445.0 1445.0 1445.0 1445.0 1500.0 1500.0 1500.0 1500.0 1500.0 1500.0 1565.0 1565.0 1565.0 1565.0 1565.0 1565.0 1565.0 1670.0 1670.0
Na2O wt. % 4.90 4.56 4.55 5.28 5.28 5.34 5.29 5.17 5.25 5.38 5.24 5.46 5.36 5.30 5.25 5.41 5.41 5.97 5.30 5.66 5.71 5.31 5.00 5.06
K2O wt. % 0.25 0.30 0.24 0.26 0.24 0.28 0.29 0.21 0.22 0.29 0.27 0.25 0.26 0.23 0.31 0.23 0.28 0.32 0.23 0.23 0.25 0.20 0.31 0.29
SiO2 wt. % 53.01 52.76 52.39 54.37 54.36 54.22 54.14 53.82 54.08 55.22 55.11 55.79 55.59 55.64 55.59 54.56 55.80 56.43 55.23 55.49 55.26 54.81 54.64 54.63
Al2O3 wt. % 29.46 29.74 29.59 29.00 28.88 28.70 28.54 28.98 28.94 28.10 28.04 28.29 28.15 27.99 28.15 28.49 28.29 27.64 28.48 28.26 28.24 28.59 29.32 29.00
FeO wt. % 0.35 0.40 0.47 0.35 0.29 0.35 0.35 0.31 0.27 0.45 0.43 0.47 0.50 0.40 0.48 0.46 0.45 0.35 0.49 0.39 0.36 0.44 0.40 0.44
CaO wt. % 12.13 12.43 12.36 11.44 11.22 11.22 11.35 11.45 11.32 10.69 11.19 10.96 10.89 11.24 11.16 11.15 10.97 10.11 11.08 10.51 10.51 11.12 11.70 11.50
BaO wt. % 0.04 0.09 0.09 0.01 >0.01 0.06 0.01 0.06 0.10 >0.01 >0.01 0.04 0.06 >0.01 0.06 0.03 >0.01 0.09 0.07 0.04 0.06 0.10 >0.01 >0.01
SrO wt. % >0.01 >0.01 >0.01 0.02 >0.01 >0.01 >0.01 >0.01 0.01 0.04 >0.01 >0.01 >0.01 >0.01 >0.01 >0.01 >0.01 >0.01 >0.01 >0.01 0.01 0.01 >0.01 >0.01
Total wt. % 100.136 100.269 99.695 100.733 100.267 100.149 99.977 99.989 100.18 100.165 100.282 101.256 100.802 100.805 100.981 100.329 101.198 100.912 100.864 100.562 100.387 100.578 101.361 100.905
Na * 0.43 0.40 0.40 0.46 0.46 0.47 0.47 0.45 0.46 0.47 0.46 0.47 0.47 0.46 0.46 0.47 0.47 0.52 0.46 0.49 0.50 0.46 0.43 0.44
K * 0.01 0.02 0.01 0.02 0.01 0.02 0.02 0.01 0.01 0.02 0.02 0.01 0.02 0.01 0.02 0.01 0.02 0.02 0.01 0.01 0.01 0.01 0.02 0.02
Si * 2.41 2.39 2.39 2.45 2.45 2.45 2.45 2.44 2.45 2.49 2.49 2.49 2.49 2.50 2.49 2.46 2.49 2.52 2.48 2.49 2.49 2.47 2.44 2.45
Al * 1.58 1.59 1.59 1.54 1.54 1.53 1.53 1.55 1.54 1.49 1.49 1.49 1.49 1.48 1.49 1.52 1.49 1.46 1.51 1.50 1.50 1.52 1.54 1.53
Fe * 0.01 0.02 0.02 0.01 0.01 0.01 0.01 0.01 0.01 0.02 0.02 0.02 0.02 0.02 0.02 0.02 0.02 0.01 0.02 0.01 0.01 0.02 0.02 0.02
Ca * 0.59 0.60 0.60 0.55 0.54 0.54 0.55 0.56 0.55 0.52 0.54 0.52 0.52 0.54 0.54 0.54 0.53 0.48 0.53 0.51 0.51 0.54 0.56 0.55
Ba * >0.01 >0.01 >0.01 >0.01 >0.01 >0.01 >0.01 >0.01 >0.01 >0.01 >0.01 >0.01 >0.01 >0.01 >0.01 >0.01 >0.01 >0.01 >0.01 >0.01 >0.01 >0.01 >0.01 >0.01
Sr * >0.01 >0.01 >0.01 >0.01 >0.01 >0.01 >0.01 >0.01 >0.01 >0.01 >0.01 >0.01 >0.01 >0.01 >0.01 >0.01 >0.01 >0.01 >0.01 >0.01 >0.01 >0.01 >0.01 >0.01
Total * 5.03 5.02 5.02 5.02 5.02 5.03 5.03 5.02 5.02 5.01 5.01 5.01 5.00 5.00 5.00 5.02 5.01 5.02 5.01 5.01 5.02 5.01 5.01 5.01
AB % 41.65 39.19 39.44 44.86 45.34 45.58 45.02 44.44 45.08 46.89 45.19 46.71 46.43 45.43 45.20 46.13 46.41 50.74 45.83 48.75 48.88 45.84 42.82 43.59
OR % 1.38 1.72 1.38 1.45 1.36 1.55 1.63 1.18 1.23 1.65 1.52 1.41 1.48 1.31 1.73 1.31 1.59 1.79 1.29 1.28 1.39 1.14 1.77 1.65
AN. % 56.97 59.09 59.17 53.69 53.30 52.87 53.36 54.38 53.69 51.46 53.29 51.88 52.09 53.26 53.06 52.56 52.00 47.48 52.88 49.97 49.73 53.02 55.41 54.76
SC19 SC19 SC19 SC19 SC19 SC20 SC20 SC20 SC20 SC20 SC20 SC21 SC21 SC21 SC21 SC21 SC25 SC25 SC25 SC25 SC25 SC25 SC25 SC26
PL2.1 PL2.2 PL3.1 PL3.2 PL3.3 PL1.1 PL1.2 PL2.1 PL2.2 PL3.1 PL3.2 PL1.1 PL1.2 PL2.1 PL2.2 PL3.1 PL1.1 PL2.1 PL2.2 PL3.1 PL3.2 PL4.1 PL4.2 PL1.1
Location (m) 1670.0 1670.0 1670.0 1670.0 1670.0 1748.0 1748.0 1748.0 1748.0 1748.0 1748.0 1800.0 1800.0 1800.0 1800.0 1800.0 2171.0 2171.0 2171.0 2171.0 2171.0 2171.0 2171.0 2278.0
Na2O wt. % 4.94 5.01 4.40 4.86 4.84 4.83 5.11 5.00 4.97 4.72 4.86 4.14 4.08 4.51 4.38 4.61 5.12 5.28 4.60 5.30 4.53 4.89 5.37 4.44
K2O wt. % 0.31 0.24 0.24 0.25 0.25 0.22 0.19 0.16 0.20 0.24 0.20 0.30 0.24 0.22 0.21 0.21 0.17 0.18 0.17 0.20 0.22 0.16 0.22 0.26
SiO2 wt. % 54.38 54.64 52.55 53.75 54.15 53.08 54.04 53.89 54.02 53.94 54.10 52.80 52.39 53.70 53.17 53.33 54.30 54.90 53.44 54.58 53.05 53.97 55.04 53.44
Al2O3 wt. % 29.09 29.06 29.94 29.52 29.14 29.00 28.72 28.88 29.09 29.17 28.97 29.93 30.28 29.79 29.78 29.74 28.88 29.08 29.81 28.82 29.58 29.44 29.04 29.95
FeO wt. % 0.71 0.41 0.34 0.36 0.34 0.43 0.38 0.49 0.47 0.47 0.48 0.34 0.39 0.22 0.26 0.27 0.39 0.34 0.34 0.38 0.40 0.42 0.21 0.21
CaO wt. % 11.67 11.44 12.51 11.90 11.83 11.77 11.40 11.74 11.62 11.97 11.65 12.90 13.48 12.46 12.49 12.33 11.54 11.70 12.55 11.18 12.63 11.83 11.42 12.46
BaO wt. % >0.01 0.01 0.03 >0.01 >0.01 >0.01 >0.01 0.01 0.01 >0.01 0.01 >0.01 >0.01 >0.01 >0.01 >0.01 0.13 >0.01 0.10 0.06 0.11 0.03 >0.01 >0.01
SrO wt. % >0.01 >0.01 0.02 >0.01 >0.01 >0.01 >0.01 >0.01 >0.01 >0.01 >0.01 >0.01 0.01 >0.01 >0.01 0.03 >0.01 >0.01 >0.01 >0.01 >0.01 >0.01 >0.01 >0.01
Total wt. % 101.088 100.817 100.035 100.631 100.546 99.325 99.832 100.162 100.384 100.499 100.271 100.416 100.859 100.911 100.291 100.518 100.519 101.488 101.009 100.511 100.525 100.729 101.299 100.763
Na * 0.43 0.44 0.39 0.43 0.42 0.43 0.45 0.44 0.44 0.41 0.43 0.36 0.36 0.39 0.38 0.40 0.45 0.46 0.40 0.46 0.40 0.43 0.47 0.39
K * 0.02 0.01 0.01 0.01 0.01 0.01 0.01 0.01 0.01 0.01 0.01 0.02 0.01 0.01 0.01 0.01 0.01 0.01 0.01 0.01 0.01 0.01 0.01 0.02
Si * 2.44 2.45 2.39 2.42 2.44 2.42 2.45 2.44 2.44 2.43 2.44 2.39 2.37 2.41 2.40 2.41 2.45 2.45 2.40 2.46 2.40 2.43 2.46 2.40
Al * 1.54 1.54 1.60 1.57 1.55 1.56 1.53 1.54 1.55 1.55 1.54 1.60 1.61 1.58 1.59 1.58 1.53 1.53 1.58 1.53 1.58 1.56 1.53 1.59
Fe * 0.03 0.02 0.01 0.01 0.01 0.02 0.01 0.02 0.02 0.02 0.02 0.01 0.02 0.01 0.01 0.01 0.02 0.01 0.01 0.01 0.02 0.02 0.01 0.01
Ca * 0.56 0.55 0.61 0.58 0.57 0.58 0.55 0.57 0.56 0.58 0.56 0.63 0.65 0.60 0.61 0.60 0.56 0.56 0.61 0.54 0.61 0.57 0.55 0.60
Ba * >0.01 >0.01 >0.01 >0.01 >0.01 >0.01 >0.01 >0.01 >0.01 >0.01 >0.01 >0.01 >0.01 >0.01 >0.01 >0.01 >0.01 >0.01 >0.01 >0.01 >0.01 >0.01 >0.01 >0.01
Sr * >0.01 >0.01 >0.01 >0.01 >0.01 >0.01 >0.01 >0.01 >0.01 >0.01 >0.01 >0.01 >0.01 >0.01 >0.01 >0.01 >0.01 >0.01 >0.01 >0.01 >0.01 >0.01 >0.01 >0.01
Total * 5.02 5.00 5.01 5.02 5.01 5.02 5.01 5.02 5.01 5.01 5.00 5.00 5.01 5.00 5.00 5.01 5.01 5.02 5.01 5.02 5.02 5.01 5.02 5.00
AB % 42.64 43.58 38.36 41.90 41.96 42.08 44.29 43.14 43.13 41.06 42.52 36.11 34.91 39.06 38.33 39.87 44.10 44.50 39.50 45.67 38.86 42.40 45.43 38.63
OR % 1.75 1.40 1.39 1.40 1.43 1.28 1.09 0.90 1.15 1.35 1.17 1.72 1.36 1.27 1.20 1.17 0.96 1.01 0.94 1.14 1.27 0.90 1.21 1.51
AN. % 55.62 55.02 60.26 56.70 56.62 56.64 54.63 55.97 55.73 57.59 56.31 62.16 63.73 59.67 60.47 58.97 54.94 54.49 59.57 53.19 59.87 56.70 53.35 59.86
SC26 SC26 SC26 SC26 SC26 SC27 SC27 SC27 SC27 SC27 SC27
PL1.2 PL1.3 PL2.1 PL2.2 PL2.3 PL1.1 PL1.2 PL2.1 PL2.2 PL3.1 PL4.1
Location (m) 2278.0 2278.0 2278.0 2278.0 2278.0 2448.0 2448.0 2448.0 2448.0 2448.0 2448.0
Na2O wt. % 4.50 4.47 4.91 4.83 4.69 5.08 5.21 5.78 5.65 5.33 5.35
K2O wt. % 0.25 0.39 0.16 0.15 0.21 0.31 0.29 0.37 0.35 0.25 0.32
SiO2 wt. % 53.07 53.52 53.66 53.70 53.61 54.76 54.98 56.14 56.37 55.24 55.72
Al2O3 wt. % 30.02 29.34 29.19 29.24 29.51 28.72 28.93 28.10 28.11 28.51 28.26
FeO wt. % 0.22 0.29 0.41 0.35 0.34 0.15 0.23 0.25 0.30 0.31 0.24
CaO wt. % 12.67 12.44 11.94 11.94 12.26 11.55 11.30 10.51 10.51 11.20 11.08
BaO wt. % 0.26 >0.01 >0.01 0.03 >0.01 >0.01 0.09 >0.01 0.01 0.16 0.11
SrO wt. % >0.01 >0.01 >0.01 >0.01 >0.01 >0.01 0.03 0.03 >0.01 >0.01 >0.01
Total wt. % 100.988 100.445 100.255 100.225 100.618 100.582 101.058 101.179 101.299 100.988 101.08
Na * 0.39 0.39 0.43 0.42 0.41 0.44 0.45 0.50 0.49 0.46 0.46
K * 0.01 0.02 0.01 0.01 0.01 0.02 0.02 0.02 0.02 0.01 0.02
Si * 2.39 2.42 2.43 2.43 2.42 2.46 2.46 2.51 2.51 2.48 2.49
Al * 1.59 1.56 1.56 1.56 1.57 1.52 1.53 1.48 1.48 1.51 1.49
Fe * 0.01 0.01 0.02 0.01 0.01 0.01 0.01 0.01 0.01 0.01 0.01
Ca * 0.61 0.60 0.58 0.58 0.59 0.56 0.54 0.50 0.50 0.54 0.53
Ba * 0.01 >0.01 >0.01 >0.01 >0.01 >0.01 >0.01 >0.01 >0.01 >0.01 >0.01
Sr * >0.01 >0.01 >0.01 >0.01 >0.01 >0.01 >0.01 >0.01 >0.01 >0.01 >0.01
Total * 5.02 5.01 5.02 5.01 5.01 5.01 5.01 5.02 5.01 5.01 5.01
AB % 38.54 38.54 42.27 41.92 40.44 43.55 44.73 48.87 48.33 45.61 45.79
OR % 1.42 2.24 0.88 0.84 1.19 1.75 1.64 2.06 1.95 1.40 1.82
AN. % 60.04 59.22 56.84 57.24 58.37 54.70 53.63 49.07 49.72 52.99 52.39
Sample
Analysis
SE
RR
A D
O O
NÇ
A C
OM
PLE
XS
ER
RA
DO
ON
ÇA
CO
MP
LE
X
Sample
SE
RR
A D
O O
NÇ
A C
OM
PLE
X
Sample
Analysis
Analysis
SE
RR
A D
O O
NÇ
A C
OM
PLE
X
Sample
Analysis
SE
RR
A D
O O
NÇ
A C
OM
PLE
X
Sample
Analysis

VIII
SC33A SC33A SC33A SC33A SC33A SC33A SC34A SC34A SC34A SC34A SC34A SC34A SC34A SC34A SC34A SC35 SC35 SC35 SC35 SC35 SC35 SC35 SC35 SC35
PL1.1 PL1.2 PL1.3 PL2.1 PL2.2 PL3.1 PL1.1 PL1.2 PL1.3 PL2.1 PL2.2 PL3.1 PL4.1 PL4.2 PL5.1 PL1.1 PL1.2 PL2.1 PL2.2 PL3.1 PL3.1 PL3.2 PL4.1 PL4.2
Location (m) 2391.0 2391.0 2391.0 2391.0 2391.0 2391.0 2254.0 2254.0 2254.0 2254.0 2254.0 2254.0 2254.0 2254.0 2254.0 2210.0 2210.0 2210.0 2210.0 2210.0 2210.0 2210.0 2210.0 2210.0
Na2O wt. % 5.44 5.38 5.52 5.25 5.42 5.50 7.14 6.54 6.32 6.60 6.60 4.75 6.73 4.98 6.33 5.72 5.76 6.05 5.92 7.13 6.00 5.96 5.53 5.24
K2O wt. % 0.06 0.11 0.04 0.07 0.06 0.13 0.06 0.02 0.07 0.22 0.06 0.03 0.06 0.04 0.10 0.09 0.05 0.08 0.06 0.08 0.12 0.06 0.22 0.08
SiO2 wt. % 55.21 54.77 54.93 53.99 54.73 54.53 58.65 57.54 56.57 56.90 57.04 53.82 57.81 54.34 56.03 55.74 55.57 56.78 56.16 58.90 55.44 56.73 53.32 55.13
Al2O3 wt. % 28.65 28.45 29.01 29.38 29.13 29.10 26.49 27.63 28.19 26.52 27.53 30.24 27.10 29.82 27.81 28.72 28.84 28.56 28.59 26.84 28.38 28.36 27.36 29.29
FeO wt. % 0.07 0.25 0.08 0.35 0.15 0.45 0.12 0.12 0.18 0.88 0.14 0.23 0.30 0.14 0.55 0.06 0.04 >0.01 0.15 0.12 1.59 0.22 2.10 0.25
CaO wt. % 11.05 11.28 11.05 11.70 11.40 11.12 8.38 9.35 9.70 8.88 9.35 12.54 9.06 11.82 9.87 10.94 11.06 10.27 10.41 8.48 9.91 10.23 11.35 11.32
BaO wt. % >0.01 0.10 >0.01 >0.01 >0.01 >0.01 0.10 >0.01 >0.01 >0.01 >0.01 0.14 0.19 0.08 0.11 0.08 >0.01 0.04 >0.01 0.13 0.11 >0.01 >0.01 >0.01
SrO wt. % 0.02 >0.01 >0.01 >0.01 >0.01 >0.01 0.05 >0.01 >0.01 >0.01 >0.01 >0.01 >0.01 0.07 >0.01 >0.01 0.02 >0.01 >0.01 >0.01 >0.01 >0.01 >0.01 >0.01
Total wt. % 100.499 100.34 100.631 100.743 100.881 100.821 100.989 101.191 101.028 99.995 100.709 101.739 101.258 101.288 100.805 101.344 101.337 101.778 101.295 101.667 101.542 101.547 99.878 101.315
Na * 0.47 0.47 0.48 0.46 0.47 0.48 0.61 0.56 0.55 0.58 0.57 0.41 0.58 0.43 0.55 0.49 0.50 0.52 0.51 0.61 0.52 0.51 0.49 0.45
K * >0.01 0.01 >0.01 >0.01 >0.01 0.01 >0.01 >0.01 >0.01 0.01 >0.01 >0.01 >0.01 >0.01 0.01 0.01 >0.01 >0.01 >0.01 >0.01 0.01 >0.01 0.01 0.01
Si * 2.48 2.47 2.46 2.43 2.45 2.45 2.60 2.55 2.52 2.57 2.55 2.40 2.57 2.43 2.51 2.48 2.48 2.51 2.50 2.60 2.48 2.51 2.45 2.46
Al * 1.52 1.51 1.53 1.56 1.54 1.54 1.39 1.44 1.48 1.41 1.45 1.59 1.42 1.57 1.47 1.51 1.51 1.49 1.50 1.40 1.50 1.48 1.48 1.54
Fe * >0.01 0.01 >0.01 0.01 0.01 0.02 0.01 >0.01 0.01 0.03 0.01 0.01 0.01 0.01 0.02 >0.01 >0.01 >0.01 0.01 >0.01 0.06 0.01 0.08 0.01
Ca * 0.53 0.55 0.53 0.56 0.55 0.54 0.40 0.44 0.46 0.43 0.45 0.60 0.43 0.57 0.47 0.52 0.53 0.49 0.50 0.40 0.48 0.49 0.56 0.54
Ba * >0.01 >0.01 >0.01 >0.01 >0.01 >0.01 >0.01 >0.01 >0.01 >0.01 >0.01 >0.01 >0.01 >0.01 >0.01 >0.01 >0.01 >0.01 >0.01 >0.01 >0.01 >0.01 >0.01 >0.01
Sr * >0.01 >0.01 >0.01 >0.01 >0.01 >0.01 >0.01 >0.01 >0.01 >0.01 >0.01 >0.01 >0.01 >0.01 >0.01 >0.01 >0.01 >0.01 >0.01 >0.01 >0.01 >0.01 >0.01 >0.01
Total * 5.00 5.01 5.01 5.02 5.02 5.03 5.01 5.01 5.02 5.03 5.02 5.01 5.02 5.00 5.03 5.01 5.02 5.01 5.01 5.01 5.04 5.01 5.07 5.00
AB % 46.94 46.06 47.37 44.65 46.12 46.89 60.43 55.83 53.91 56.63 55.91 40.57 57.15 43.13 53.43 48.38 48.38 51.39 50.52 60.10 51.91 51.13 46.28 45.38
OR % 0.33 0.61 0.22 0.40 0.31 0.73 0.35 0.10 0.38 1.23 0.31 0.17 0.36 0.25 0.55 0.48 0.29 0.45 0.35 0.42 0.71 0.36 1.19 0.47
AN. % 52.73 53.34 52.41 54.96 53.57 52.38 39.22 44.07 45.71 42.14 43.78 59.26 42.50 56.62 46.02 51.14 51.34 48.17 49.14 39.48 47.38 48.51 52.52 54.15
SC35 SC43 SC43 SC43 SC43 SC43 SC43 SC44 SC44 SC44 SC44 SC44 SC44 SC34B SC34B SC34B SC34B SC38 SC38 SC38 SC38 SC40A SC40A SC40A
PL5.1 PL1.1 PL1.2 PL2.1 PL2.2 PL3.1 PL4.2 PL1.1 PL1.2 PL2.1 PL2.2 PL3.1 PL3.2 PL1.1 PL1.2 PL1.3 PL2.1 PL2.1 PL2.2 PL2.3 PL2.4 PL1.1 PL1.2 PL1.3
Location (m) 2210.0 1585.0 1585.0 1585.0 1585.0 1585.0 1585.0 1526.0 1526.0 1526.0 1526.0 1526.0 1526.0 2254.0 2254.0 2254.0 2254.0 2029.0 2029.0 2029.0 2029.0 1930.0 1930.0 1930.0
Na2O wt. % 6.04 5.40 5.26 5.20 5.23 4.95 4.93 4.50 4.63 4.58 4.66 4.56 4.77 4.74 4.71 4.72 0.46 3.15 4.22 3.80 4.88 4.15 4.85 4.92
K2O wt. % 0.04 0.06 0.08 0.03 0.05 0.02 0.08 0.09 0.14 0.08 0.10 0.11 0.09 0.07 0.06 0.07 >0.01 0.03 0.05 0.05 0.09 0.05 0.13 0.07
SiO2 wt. % 56.57 54.32 53.59 54.90 55.06 53.85 53.21 53.00 53.14 53.12 54.01 52.90 53.11 53.85 53.36 53.66 50.84 50.60 52.55 51.56 54.22 53.67 54.27 54.80
Al2O3 wt. % 27.70 29.36 28.71 29.30 29.13 29.47 29.44 30.07 29.54 29.95 30.26 30.01 29.74 30.04 29.88 30.10 2.77 31.92 31.11 31.16 29.74 29.52 29.08 29.63
FeO wt. % 0.18 0.22 0.32 0.07 0.21 0.03 0.24 0.28 0.36 0.01 0.19 0.29 0.11 0.19 0.34 0.20 5.93 0.25 0.27 0.25 0.23 0.23 0.22 0.19
CaO wt. % 9.95 11.23 11.30 11.68 11.36 12.08 12.30 12.89 12.36 12.37 12.23 12.90 12.52 12.33 12.40 12.66 21.10 15.28 13.45 13.87 12.09 12.45 11.18 11.86
BaO wt. % 0.03 >0.01 0.14 0.13 >0.01 0.07 0.14 0.04 >0.01 >0.01 0.03 0.06 0.03 >0.01 >0.01 >0.01 0.15 0.07 >0.01 0.07 0.01 >0.01 >0.01 0.01
SrO wt. % >0.01 >0.01 >0.01 >0.01 >0.01 0.01 >0.01 >0.01 >0.01 >0.01 >0.01 0.01 >0.01 >0.01 >0.01 >0.01 >0.01 >0.01 >0.01 >0.01 0.01 >0.01 >0.01 >0.01
Total wt. % 100.503 100.58 99.397 101.305 101.051 100.475 100.332 100.862 100.162 100.121 101.466 100.826 100.374 101.221 100.755 101.397 81.252 101.29 101.654 100.746 101.258 100.078 99.728 101.476
Na * 0.52 0.47 0.47 0.45 0.45 0.43 0.43 0.39 0.41 0.40 0.40 0.40 0.42 0.41 0.41 0.41 0.05 0.28 0.37 0.33 0.42 0.36 0.43 0.43
K * >0.01 >0.01 >0.01 >0.01 >0.01 >0.01 0.01 0.01 0.01 0.01 0.01 0.01 0.01 >0.01 >0.01 >0.01 >0.01 >0.01 >0.01 >0.01 0.01 >0.01 0.01 >0.01
Si * 2.53 2.44 2.44 2.45 2.46 2.43 2.41 2.39 2.41 2.40 2.41 2.39 2.40 2.41 2.40 2.40 3.02 2.28 2.35 2.33 2.42 2.42 2.45 2.44
Al * 1.46 1.56 1.54 1.54 1.53 1.56 1.57 1.60 1.58 1.60 1.59 1.60 1.58 1.58 1.59 1.59 0.19 1.70 1.64 1.66 1.57 1.57 1.55 1.56
Fe * 0.01 0.01 0.01 >0.01 0.01 >0.01 0.01 0.01 0.01 >0.01 0.01 0.01 >0.01 0.01 0.01 0.01 0.29 0.01 0.01 0.01 0.01 0.01 0.01 0.01
Ca * 0.48 0.54 0.55 0.56 0.54 0.58 0.60 0.62 0.60 0.60 0.58 0.62 0.61 0.59 0.60 0.61 1.34 0.74 0.65 0.67 0.58 0.60 0.54 0.57
Ba * >0.01 >0.01 >0.01 >0.01 >0.01 >0.01 >0.01 >0.01 >0.01 >0.01 >0.01 >0.01 >0.01 >0.01 >0.01 >0.01 >0.01 >0.01 >0.01 >0.01 >0.01 >0.01 >0.01 >0.01
Sr * >0.01 >0.01 >0.01 >0.01 >0.01 >0.01 >0.01 >0.01 >0.01 >0.01 >0.01 >0.01 >0.01 >0.01 >0.01 >0.01 >0.01 >0.01 >0.01 >0.01 >0.01 >0.01 >0.01 >0.01
Total * 5.00 5.02 5.02 5.01 5.00 5.01 5.03 5.01 5.01 5.00 5.00 5.02 5.02 5.01 5.01 5.01 4.91 5.01 5.01 5.01 5.01 4.97 4.99 5.00
AB % 52.22 46.38 45.51 44.54 45.31 42.55 41.86 38.50 40.09 39.94 40.60 38.76 40.60 40.88 40.58 40.11 3.82 27.13 36.11 33.03 41.99 37.54 43.63 42.72
OR % 0.22 0.31 0.43 0.16 0.31 0.13 0.46 0.50 0.80 0.48 0.56 0.63 0.51 0.38 0.36 0.39 >0.01 0.16 0.25 0.26 0.49 0.28 0.76 0.37
AN. % 47.56 53.31 54.07 55.30 54.38 57.32 57.68 60.99 59.12 59.58 58.84 60.61 58.89 58.74 59.06 59.50 96.18 72.71 63.64 66.71 57.52 62.18 55.62 56.91
SC40A SC40A SC41 SC41 SC41 SC41 SC41 SC41 SC41 SC41 SC41 SC41 SC41 SC45 SC45 SC45 SC45 SC45 SC45 SC45 SC46 SC46 SC46 SC46
PL1.4 PL1.5 PL1.1 PL1.2 PL1.3 PL1.4 PL1.5 PL2.1 PL2.2 PL3.1 PL3.2 PL4.1 PL4.2 PL1.1 PL1.2 PL1.3 PL2.1 PL2.2 PL3.1 PL3.2 PL1.1 PL1.2 PL1.3 PL2.1
Location (m) 1930.0 1930.0 1850.0 1850.0 1850.0 1850.0 1850.0 1850.0 1850.0 1850.0 1850.0 1850.0 1850.0 1473.0 1473.0 1473.0 1473.0 1473.0 1473.0 1473.0 1213.0 1213.0 1213.0 1213.0
Na2O wt. % 4.99 4.74 0.45 3.97 2.82 4.55 4.14 5.18 5.06 3.79 3.89 3.02 3.84 4.09 4.75 4.98 4.49 4.71 4.43 4.44 5.89 5.78 5.80 7.06
K2O wt. % 0.06 0.27 >0.01 0.05 0.12 0.09 0.09 0.07 0.06 0.08 0.04 0.16 0.53 0.05 0.08 0.06 0.11 0.05 0.09 0.06 0.14 0.25 0.18 0.16
SiO2 wt. % 53.93 53.82 50.30 51.44 47.43 52.78 51.99 53.54 53.83 50.46 51.31 49.23 51.04 51.89 52.64 53.25 52.27 52.87 52.30 52.62 55.43 55.74 55.97 58.21
Al2O3 wt. % 29.39 29.58 2.32 30.38 29.08 29.77 30.52 29.15 29.28 30.56 30.55 31.95 30.14 30.65 29.84 29.40 30.05 29.75 30.02 30.23 28.02 28.32 28.28 26.41
FeO wt. % 0.25 0.76 6.01 0.22 0.31 0.33 0.39 0.26 0.27 0.37 0.37 0.73 0.26 0.27 0.27 0.22 0.31 0.18 0.62 0.16 0.22 0.25 0.19 0.33
CaO wt. % 11.89 12.18 19.78 12.92 13.48 12.53 13.11 11.29 11.75 13.46 13.44 14.82 12.91 13.09 12.34 11.95 12.38 12.18 12.80 12.80 10.42 10.08 10.39 8.40
BaO wt. % 0.03 0.06 >0.01 0.05 >0.01 >0.01 >0.01 0.01 >0.01 0.02 >0.01 0.02 0.10 >0.01 0.01 0.06 0.04 >0.01 >0.01 >0.01 >0.01 0.13 0.02 0.02
SrO wt. % >0.01 >0.01 >0.01 >0.01 >0.01 >0.01 >0.01 >0.01 >0.01 >0.01 >0.01 >0.01 >0.01 >0.01 >0.01 >0.01 >0.01 >0.01 >0.01 >0.01 >0.01 >0.01 >0.01 >0.01
Total wt. % 100.542 101.395 78.866 99.018 93.235 100.048 100.232 99.497 100.241 98.734 99.606 99.918 98.817 100.03 99.93 99.913 99.642 99.742 100.252 100.308 100.117 100.557 100.834 100.59
Na * 0.44 0.41 0.05 0.35 0.27 0.40 0.36 0.46 0.44 0.34 0.35 0.27 0.34 0.36 0.42 0.44 0.40 0.42 0.39 0.39 0.51 0.50 0.50 0.61
K * >0.01 0.02 >0.01 >0.01 0.01 0.01 0.01 >0.01 >0.01 0.01 >0.01 0.01 0.03 >0.01 >0.01 >0.01 0.01 >0.01 0.01 >0.01 0.01 0.01 0.01 0.01
Si * 2.43 2.41 3.06 2.36 2.32 2.39 2.36 2.43 2.43 2.33 2.34 2.26 2.35 2.36 2.39 2.42 2.38 2.40 2.37 2.38 2.50 2.50 2.50 2.60
Al * 1.56 1.56 0.17 1.64 1.67 1.59 1.63 1.56 1.56 1.66 1.65 1.73 1.64 1.64 1.60 1.57 1.61 1.59 1.61 1.61 1.49 1.50 1.49 1.39
Fe * 0.01 0.03 0.31 0.01 0.01 0.01 0.02 0.01 0.01 0.01 0.01 0.03 0.01 0.01 0.01 0.01 >0.01 0.01 0.02 0.01 0.01 0.01 0.01 0.01
Ca * 0.57 0.59 1.29 0.64 0.71 0.61 0.64 0.55 0.57 0.67 0.66 0.73 0.64 0.64 0.60 0.58 0.60 0.59 0.62 0.62 0.50 0.48 0.50 0.40
Ba * >0.01 >0.01 >0.01 >0.01 >0.01 >0.01 >0.01 >0.01 >0.01 >0.01 >0.01 >0.01 >0.01 >0.01 >0.01 >0.01 >0.01 >0.01 >0.01 >0.01 >0.01 >0.01 >0.01 >0.01
Sr * >0.01 >0.01 >0.01 >0.01 >0.01 >0.01 >0.01 >0.01 >0.01 >0.01 >0.01 >0.01 >0.01 >0.01 >0.01 >0.01 >0.01 >0.01 >0.01 >0.01 >0.01 >0.01 >0.01 >0.01
Total * 5.01 5.02 4.88 5.00 4.98 5.01 5.01 5.02 5.01 5.01 5.01 5.02 5.02 5.01 5.02 5.02 5.00 5.01 5.02 5.01 5.02 5.01 5.01 5.02
AB % 43.01 40.71 3.99 35.62 27.30 39.43 36.16 45.15 43.63 33.59 34.32 26.69 33.92 35.99 40.89 42.86 39.39 41.08 38.31 38.46 50.16 50.20 49.72 59.82
OR % 0.32 1.52 >0.01 0.28 0.74 0.54 0.51 0.41 0.34 0.46 0.23 0.90 3.09 0.29 0.44 0.32 0.61 0.27 0.52 0.32 0.80 1.42 1.03 0.87
AN. % 56.663 57.778 96.015 64.1 71.962 60.03 63.335 54.436 56.034 65.959 65.453 72.407 62.984 63.727 58.673 56.822 59.999 58.65 61.175 61.218 49.042 48.382 49.257 39.31
SC46 SC46 SC46 SC46 SC46 SC47A SC47A SC47A SC47A SC47A SC47A SC47A SC47A SC47B SC47B SC47B SC47B SC47B SC47B SC47B SC47B
PL2.2 PL3.1 PL3.2 PL4.1 PL4.2 PL1.1 PL1.2 PL2.1 PL2.2 PL3.1 PL3.2 PL4.1 PL4.2 PL1.1 PL1.2 PL2.1 PL2.2 PL3.1 PL3.2 PL4.1 PL4.2
Location (m) 1213.0 1213.0 1213.0 1213.0 1213.0 1184.0 1184.0 1184.0 1184.0 1184.0 1184.0 1184.0 1184.0 1184.0 1184.0 1184.0 1184.0 1184.0 1184.0 1184.0 1184.0
Na2O wt. % 6.83 6.18 6.16 5.73 5.55 4.10 4.25 4.54 4.41 3.98 4.28 4.38 4.42 4.18 4.40 4.15 4.38 4.14 4.34 4.18 4.25
K2O wt. % 0.11 0.11 0.11 0.15 0.15 0.07 0.10 0.09 0.12 0.06 0.06 0.05 0.05 0.07 0.11 0.05 0.10 0.06 0.08 0.09 0.10
SiO2 wt. % 57.96 56.32 55.69 55.67 55.26 51.71 51.96 52.76 52.33 51.69 51.73 52.32 52.64 51.64 51.77 51.57 51.43 51.97 52.19 51.82 52.30
Al2O3 wt. % 26.84 27.83 27.98 28.26 28.44 30.42 30.18 29.92 29.97 30.43 30.27 30.10 30.12 30.11 29.63 29.93 30.02 30.55 30.02 30.70 30.40
FeO wt. % 0.18 0.20 0.19 0.21 0.24 0.27 0.23 0.21 0.18 0.30 0.29 0.26 0.33 0.24 0.49 0.16 0.15 0.24 0.27 0.26 0.30
CaO wt. % 8.42 9.81 9.85 10.40 10.99 13.33 12.92 12.59 12.54 13.10 13.03 12.76 12.70 12.87 12.42 12.94 12.62 13.30 13.22 13.35 12.84
BaO wt. % 0.05 >0.01 >0.01 0.04 0.04 >0.01 0.05 0.09 0.05 >0.01 0.08 >0.01 0.01 0.04 >0.01 >0.01 0.07 0.20 0.09 0.01 >0.01
SrO wt. % >0.01 >0.01 >0.01 >0.01 >0.01 >0.01 >0.01 >0.01 >0.01 >0.01 >0.01 >0.01 >0.01 >0.01 >0.01 >0.01 >0.01 >0.01 >0.01 >0.01 >0.01
Total wt. % 100.388 100.441 99.984 100.458 100.668 99.894 99.682 100.198 99.593 99.557 99.743 99.866 100.267 99.149 98.817 98.801 98.766 100.467 100.194 100.423 100.192
Na * 0.59 0.54 0.54 0.50 0.48 0.36 0.38 0.40 0.39 0.35 0.38 0.39 0.39 0.37 0.39 0.37 0.39 0.36 0.38 0.37 0.37
K * 0.01 0.01 0.01 0.01 0.01 >0.01 0.01 0.01 0.01 >0.01 >0.01 >0.01 >0.01 >0.01 0.01 >0.01 0.01 >0.01 >0.01 0.01 0.01
Si * 2.59 2.52 2.51 2.50 2.48 2.35 2.37 2.39 2.38 2.36 2.36 2.38 2.38 2.37 2.38 2.37 2.37 2.36 2.37 2.35 2.37
Al * 1.41 1.47 1.49 1.50 1.50 1.63 1.62 1.60 1.61 1.64 1.63 1.61 1.61 1.63 1.61 1.62 1.63 1.63 1.61 1.64 1.62
Fe * 0.01 0.01 0.01 0.01 0.01 0.01 0.01 0.01 0.01 0.01 0.01 0.01 0.01 0.01 0.02 0.01 0.01 0.01 0.01 0.01 0.01
Ca * 0.40 0.47 0.48 0.50 0.53 0.65 0.63 0.61 0.61 0.64 0.64 0.62 0.62 0.63 0.61 0.64 0.62 0.65 0.64 0.65 0.62
Ba * >0.01 >0.01 >0.01 >0.01 >0.01 >0.01 >0.01 >0.01 >0.01 >0.01 >0.01 >0.01 >0.01 >0.01 >0.01 >0.01 >0.01 >0.01 >0.01 >0.01 >0.01
Sr * >0.01 >0.01 >0.01 >0.01 >0.01 >0.01 >0.01 >0.01 >0.01 >0.01 >0.01 >0.01 >0.01 >0.01 >0.01 >0.01 >0.01 >0.01 >0.01 >0.01 >0.01
Total * 5.01 5.01 5.02 5.01 5.01 5.01 5.01 5.01 5.01 5.00 5.02 5.01 5.01 5.01 5.02 5.01 5.02 5.01 5.02 5.02 5.01
AB % 59.12 52.95 52.76 49.51 47.36 35.61 37.12 39.28 38.60 35.35 37.19 38.24 38.54 36.85 38.84 36.59 38.35 35.91 37.10 35.99 37.26
OR % 0.61 0.61 0.63 0.87 0.84 0.39 0.57 0.53 0.67 0.33 0.33 0.26 0.28 0.43 0.62 0.30 0.56 0.36 0.44 0.52 0.56
AN. % 40.28 46.44 46.60 49.62 51.80 64.00 62.31 60.20 60.74 64.32 62.48 61.50 61.18 62.72 60.54 63.11 61.09 63.73 62.47 63.48 62.18
SE
RR
A D
O P
UM
A C
OM
PLE
X
Sample
Analysis
SE
RR
A D
O P
UM
A C
OM
PLE
X
Sample
Analysis
SE
RR
A D
O P
UM
A C
OM
PLE
X
Sample
Analysis
SE
RR
A D
O P
UM
A C
OM
PLE
X
Sample
Analysis