carlos a nobre instituto nacional de pesquisas … futuro da vegetação da amazônia em resposta ao...
TRANSCRIPT

MudanMudanççasas ClimClimááticasticas e a e a Amazônia Amazônia
Carlos A NobreInstituto Nacional de Pesquisas Espaciais- INPE
Cortesia do slide IPAM
50ª Reunião Extraordinária do CONAMA–
Mesa 3, Impactos nas Áreas Florestais: Amazônia, Caatinga, Cerrado e Mata Atlântica.
Rio de Janeiro, 30 de maio de 2007

escala 1:30.000.000
Biomas do Brasil
AmazôniaCaatingaCampos sulinosCerradoCosteiroMata AtlânticaPantanal
Transição (Amazônia-Cerrado)Transição (Amazônia-Cerrado-Caatinga)Transição (Mata Atlântica-Caatinga-Cerrado)
Ecótonos: Ecorregiões transicionais que contém elementos de mais de um bioma
Figura 1: BIOMAS DO BRASIL
Projeção sinusoidal, meridiano central (-54 graus)Nesta projeção a área das feições é preservada
Complexidade

Biomes of tropical south America and Sazonalidade da Precipitação
Sombroek 2001, Ambio
Número de meses consecutivos com chuva abaixo de 50 mm
Precipitação Anual
Biomas do Brasil
A importância dasazonalidade das
chuvas (curtasestações secas) para
manutenção da florestatropical
Floresta Tropical Caatinga
Savana
Fronteira FlorestaTropical-Savana

Evapotranspiração: Sazonalidade naFloresta Amazônicae na SavanaFonte: Rocha (2004)
Cerrado s.s. SP
Floresta trop RO
Floresta trop Manaus
Floresta trop Santarém
Floresta
Savana
Floresta
Savanna
Late
ntH
eatf
lux
(W m
-2)
mm
day-1
Net
Rad
iatio
n(W
m-2
)

Source: Obregon, 2001
1 mm < P < 5 mm
SACZ
BreisasInstability lines
Precipitação Anual
Unconditional probability of a wet day. The daily data spans 1979 to 1993
5 mm < P < 25 mm
Mecanismos de Precipitação na Amazônia18 UTC
03 UTC

Water extraction at least up to 10 m
68%
Source: Bruno et al., 2005 – Tropical forest data in Santarem km83
Exemplo de Adaptação Ecológica: Raízes Profundas
Wet seasonDry season
84%
Fraction of water extracted by roots
Dep
th (m
)

As cvariabilidade climática (secas severas)desempenha um papel chage em ligar as mudancas climáticas, fatores edáficos e humanos?
Até 2006, área desmatada total (corte raso) foi d650,000 km2 na Amazônia Brasileira (17%)
Source: Greenpeace/Daniel Beltra
Resiliência Perturbações Estocásticas Perturbações Graduaisafetam a Resiliência(e.g., desmatamento, fogoFragmentação, aquecimento global, etc.)

I - DESMATAMENTOS
DEFORESTATION AND BURNING AROUND THE XINGU INDIGENOUS PARK, MATO GROSSO STATE, BRAZIL, 2004.Source: Tropical deforestation and climate change / edited by Paulo Moutinho and Stephan
Schwartzman. -- IPAM - Instituto de Pesquisa Ambiental da Amazônia, 2005.

PROJEÇÕES DE DESMATAMENTOSControl 20% 40% 50%
60% 80% 100%
or Soybean
Source: Soares-Filho et al., 2006 - Amazon Scenarios Project, LBA Sampaio et al., 2007

Amazonia - PASTURE
0.6
0.7
0.8
0.9
1
1.1
1.2
0.0% 20.0% 40.0% 50.0% 60.0% 80.0% 100.0%
Deforestation Area (%)
Rel
ativ
e Pr
ecip
itatio
n
DJF
MAM
JJA
SON
Precipitação – AmazôniaAmazonia - SOYBEAN
0.6
0.7
0.8
0.9
1.0
1.1
1.2
0.00% 20.00% 40.00% 60.00% 80.00% 100.00%
Deforestation Area (%)
Rel
ativ
e Pr
ecip
itatio
n
DJF
MAM
JJASON
Estação do Ano Pastagem SojaJJA -15,7% -24,0%
-13,7%JJAS -22,0%
Anomalia de Precipitação (%)
Sampaio et al., 2007

Estação do Ano Pastagem SojaJJA -27,5%
-28,1%SON-3,.8%-39,9%
PrecipitaçãoAmazonia - PASTUREArea: East/Northeast
0.6
0.7
0.8
0.9
1.0
1.1
1.2
0% 20% 40% 60% 80% 100%
Deforestation Area (%)
Rel
ativ
e Pr
ecip
itatio
n (p
/p0)
DJFMAMJJASON
Amazonia - SOYBEANArea: East/Northeast
0.6
0.7
0.8
0.9
1.0
1.1
1.2
0% 20% 40% 60% 80% 100%
Deforestation Area (%)
Rela
tive
Prec
ipita
tion
(p/p
0)
DJFMAMJJASON
PASTAGEM SOJA
Anomalias de Precipitação (%)
Sampaio et al., 2007
The reduction in precipitation is larger during the dry season, and is more evident when the deforested area is larger than 40% !

II - FOGO

III – EXTREMOS CLIMÁTICOS
O impacto de secas

(A) Observed drought frequency (% years); (B) distribution of savanna, transitional vegetation, andforest across the legal Brazilian Amazon; (C) Land area (1000 km2) of vegetation types for pixelswith given drought frequency (%), forest land area is multiplied by 0.1 for scaling; (D) percentattainment of the Nix [1983] criteria for savanna vegetation in the last 100 years.
ClimateClimate conditionsconditions for tropical for tropical savannassavannas ((NixNix 1983)1983)
Tmean > 24 C13 C < Tcoldest month < 18 CP(3 driest months) < 50 mmP(6 wettest months) > 600 mm1000 mm < Pannual < 1500 mm
Source: Hutyara et al, 2005
Vulnerabilidade da Vegetação às Secas
Percent attainment of theNix criteria [1983] for savanna in the last 100 years

Anomalia de PrecipitaçãoDez-Jan-Fev-Mar de 1951/52 a 2004/05
Rainfall Anomaly Index for SW AmazoniaDec-Jan-Feb-March - 1951-52 to 2004-2005

Fonte: Greenpeace/Daniel Beltra
Foto 16 : Barco encalhado na areia a leste de Barreirinha, perto da fronteira do Pará.

Estamos assistindo a mais extremoshidrológicos?
“A Seca da Amazônia em 2005 considerada uma das mais severas em100 anos”

IV – AQUECIMENTO GLOBAL

O que ocorrerá com as florestas tropicais da América do Sul em
decorrência do Aquecimento Global?

ECOSSISTEMAS NATURAIS
• Em meados do século, projeta-se que aumentos de temperatura e conseqüentes diminuições da água do solo irão levar a uma gradual substituição da floresta tropical por savana na Amazônia Oriental.
• A vegetação semi-árida tenderá a ser substituída por vegetação de zonas áridas.
• Há um risco de perda significativa de biodiversidade através da extinção de espécies em muitas áreas tropicais da América Latina. ** D [13.4]
IPCC 2007 WG II

Source: Miles et al. 2004.
43% of 69 species of Angiospermsbecome non-viable by 2095!
Climate Model: HADCM2GSa11% CO2 increase/yr
O impacto das mudanças climáticas globais nabiodiversidade da Amazônia
= SI/2
Bacia do Rio Negro: 90% a 100% de manutenção da
biodiversidade!

A RESPOSTA BIOFÍSICA À MUDANÇA CLIMÁTICA DEPENDE DA DISPERSÃO E MIGRAÇÃO
Distribuição potencial de biomas com clima controle (Pré-industrial)
Distribuição da vegetação em resposta à mudança climática (Cenário A1F1, modelo: HADCM3)
SUPOSIÇÃO MAX: Se as condições climáticas são favoráveis, a vegetação pode-se alocar ou expandir para qualquer lugar. Higgins and Harte, 2006

Cenários de Mudanças Climáticas para a Amazônia
Resultados de 15 Modelos Acoplados Oceano-Atmosfera para os cenários SRES A2 e B1 de emissões de gases de efeitoestufa, preparados para o IPCC/AR4.
Anomalias de Temperatura
Anomalias de Chuvas
Models: BCCR-BCM2.0, CCSM3, CGCM3.1(T47), CNRM-CM3, CSIRO-MK3, ECHAM5, GFDL-CM2, GFDL-CM2.1, GISS-ER, INM-CM3, IPSL-CM4, MIROC3.2 (MEDRES), MRI-CGCM2.3.2, UKMO-HADCM3, ECHO-G

Projected distribution of natural biomes in South America for 2090-2099 from 15 AOGCMs for the A2 emissions scenarios, calculated by using CPTEC-INPE PVM.
Consequência das Mudanças Climáticas na Redistribuição de Vegetação na América do Sul
Salazar et al., 2007
Floresta
Cerrado
Caatinga

Grid points where more than 75% of the models used (> 11 models) coincide as projecting the future condition of the tropical forest and the savanna in relation with the current potential vegetation. The figure also shows the grid points where a consensus amongst the models of the future condition of the tropical forest was not found. for the periods (a) 2020-2029, (b) 2050-2059 and (c) 2090-2099 for B1 GHG emissions scenario and (d), (e) and (f) similarly for A2 GHG emissions scenario.
2050-2059 2090-20992020-2029
Salazar et al., 2007 Geoph. Res. Letters
Consequência das Mudanças Climáticas na Redistribuição de Vegetação na América do Sul
SRES B1 SRES B1 SRES B1
SRES A2 SRES A2 SRES A2

Percentage of the area where more than 75% of the experiments for the A2 GHG scenarios, coincide as projecting the permanence or disappearance of the current potential tropical forest, and where there is not a conclusive consensus amongst models
Salazar et al., 2007 GRL (accepted)
Consequência das Mudanças Climáticas na Redistribuição de Vegetação na América do Sul
Entre 18% até um máximo de 48% (18% + 30%) podem ser convertidos em savana empobrecida até o final do Século!

Conclusões O futuro da vegetação da Amazônia em resposta ao
desmatamento e às mudanças climáticas
• Os ecossistemas na Amazônia vem sofrendo por pressão dos desmatamentos por mais de 40 anos.
• O desmatamento, o aquecimento global, o aumento da incidência de incêndios florestais e secas mais intensas ou mais frequentes irão reduzir a resiliência da floresta tropical.
• O efeito sinérgico de todos estes fatores poderá desencadear um acelerado processo de “savanização” do centro-leste da Amazônia.
• O impacto deste efeito não será homogêneo na vasta Bacia Amazônica. No oeste e noroeste, as mudanças climáticas exercerão menor influênciae a biodiversidade estará menos ameaçada.
• A política de conservação deve levar em conta as mudanças climáticas sob risco de se tornar inefetiva no futuro.

OBRIGADO!

250 ppmv 180 ppmv 140 ppmv
450 ppmv 600 ppmv 850 ppmv
Currentpot veg
CPTEC-INPE PVM 2
Vegetation distribution underdifferent CO2 concentration scenarios
Lapola, 2007 MSc Thesis at INPE
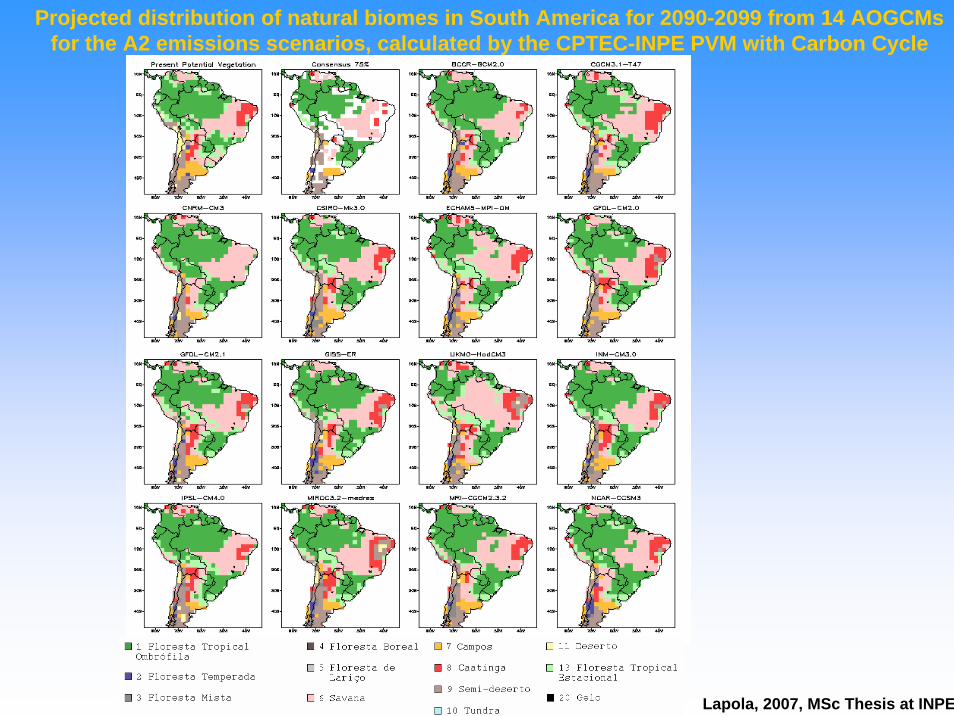
Projected distribution of natural biomes in South America for 2090-2099 from 14 AOGCMsfor the A2 emissions scenarios, calculated by the CPTEC-INPE PVM with Carbon Cycle
Lapola, 2007, MSc Thesis at INPE

The ethical dimensions of Global Environmental Change
There is an issue of ethics and justice: the people [and other forms of life] most likely to bear the brunt of Global Environmental Change are those who have contributed least to it
Historical contributions to CO2 emissions:
Europe 30%USA 28%China 8%
Amazonia 1% - 1.5%

-2°C -4°C -6°C
+2°C +4°C +6°C
Currentpot veg
CPTEC PVM 2
Vegetation distribution underdifferent annual mean temperature scenarios
Lapola et al., 2007

-0.2 -1.0 -3.0
+0.2 +1.0 +3.0
Currentpot veg
CPTEC PVM 2
Vegetation distribution underdifferent annual mean precipitation scenarios
(mm/day)
Lapola et al., 2007

Source: Oyama and Nobre, 2003
Two Biome-Climate Equilibrium States found for South America
Soil Moisture
Rainfallanomalies
-- current state (a)-- second state (b)
Current potential vegetation
Second StateResults of CPTEC-DBM Initial Conditions : desert
Savanna
Forest
0.0
1.0
2.0
3.0
4.0
5.0
6.0
1990 199119
9219
9319
9419
9519
9619
9719
9819
9920
0020
0120
0220
03
met
ric to
ns o
f car
bon
per c
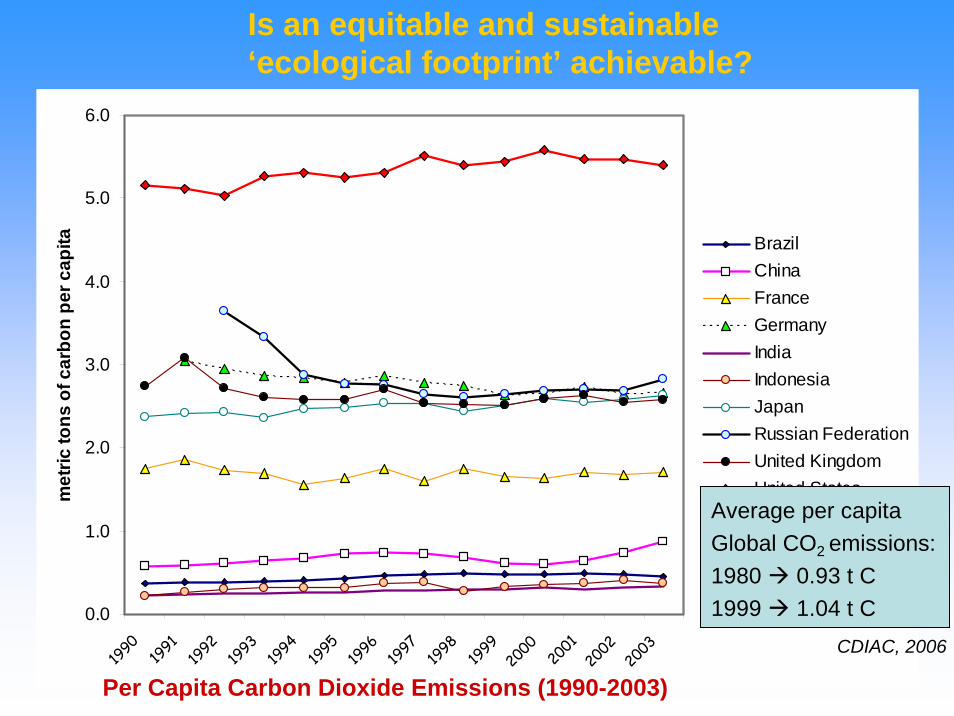
apita Brazil
ChinaFranceGermanyIndiaIndonesiaJapanRussian FederationUnited KingdomUnited States
CDIAC, 2006
Average per capitaGlobal CO2 emissions:1980 0.93 t C1999 1.04 t C
Per Capita Carbon Dioxide Emissions (1990-2003)
Is an equitable and sustainable ‘ecological footprint’ achievable?

Futuro dos Biomas Amazônicos?
fontes: Oyama and Nobre, 2003 e Salazar, Oyama and Nobre, 2007
“Savanização” da Amazônia: um estado de equilíbrio na relação bioma-clima?
floresta savana caatinga campos deserto
2000 2100