autorização para disponibilização concedida ao...
TRANSCRIPT

Autorização para disponibilização concedida ao Repositório Institucional da Universidade de Brasília (RIUnB) pelo Núcleo de Estudos Agrários e Desenvolvimento Rural do Ministério do Desenvolvimento Agrário, responsável pela publicação da obra, com as seguintes condições: disponível sob Licença Creative Commons 3.0, que permite copiar, distribuir e transmitir o trabalho, desde que seja citado o autor e licenciante. Não permite o uso para fins comerciais nem a adaptação desta.
Granted authorization to release the Institutional Repository of the University of Brasilia
(RIUnB) by the Center for Agrarian Studies and Rural Development of the Ministry of Agrarian
Development, responsible for the publication of the work under the following conditions:
available under Creative Commons 3.0 License, which allows you to copy, distribute and
transmit the work, provided that the author and licensor is mentioned. Can not use for
commercial purposes nor adaptation.
Referência
DEL GROSSI, Mauro Eduardo. Poverty reduction: from 44 million to 29.6 million people. In:
SILVA, José Graziano da; DEL GROSSI, Mauro Eduardo; FRANÇA, Caio Galvão de (Ed.). The Fome
Zero (Zero Hunger) Program: the Brazilian experience. Brasília: MDA, 2011. p. 303-318.
Disponível em: < http://www.nead.gov.br/portal/nead/nead-especial/>. Acesso em: 2 dez.
2013.

Editors:José Graziano da silva
Mauro Eduardo dEl Grossi
Caio Galvão dE França
THE FOME ZERO (ZERO HUNGER)
Food and Agriculture Organization of the United Nations (FAO)
THE
FOM
E ZE
RO (Z
ERO
HUN
GER
) PRO
GRA
M: T
HE b
RAZi
liAN
ExPE
RiEN
cEThe launching of the “Zero Hunger Project – a proposal for a food security policy for Brazil” in October 2001 by the then candidate for the presidency Luiz Inácio Lula da Silva reflected the maturing of discussions and proposals on food security and fighting hunger, which became national prio-rities to be addressed through planned and decisive actions of the State with social participation.
With the electoral victory of President Lula in 2003, the Zero Hunger project became the main governmental stra-tegy guiding economic and social policies in Brazil and ma-rked the beginning of an inflection that left behind an old dichotomy between them. Actions began to be taken to in-tegrate structural policies into emergency policies to fight hunger and poverty. New, differentiated policies for family farming were implemented and basic legislation was built for the national food and nutrition security policy.
This book is part of the NEAD Debate Series (Série NEAD Debate) and it presents some fundamental texts for one to understand the Brazilian experience with the Zero Hunger Program at different moments of its implementation over an eight-year period as a Government Program, bringing together reflections on different aspects of the process, such as the mobilization of different segments of society around it, the role of family farming, advances and challen-ges, among others.
NEAD
The Center for Agrarian Studies and Rural Development of the Ministry of Agrarian Develop-ment – NEAD/MDA is a space for reflection, dissemination and in-stitutional linkages with various national and international re-search centers, universities, non-governmental organizations, so-cial movements and cooperation agencies.The Center’s actions are guided by the challenge of contribut-ing to expand and improve pub-lic policies on agrarian reform, strengthening of family farming, promotion of equality and eth-nic development of traditional rural communities.Designed to contribute to a new development agenda, stimulate social debate and participation, and ensure democratic access to information, the partnership between NEAD/MDA and over 70 centers makes it possible for studies and surveys to be pro-duced and published, for the general public to have access to databases, for seminars to be held, and for other initiatives to be taken. Topics addressed in its institu-tional cooperation arrangements include: agrarian-related issues; regional integration and inter-national negotiations; grassroots memory and culture; gender and rural development; and the new dynamic of rural areas.For more information, kindly access the Portal www.nead.gov.br
FAO
The Food and Agriculture Organization of the United Nations leads international ef-forts to defeat hunger. Serving both developed and develop-ing countries, FAO acts as a neutral forum where all na-tions meet as equals to nego-tiate agreements and debate policy. FAO is also a source of knowledge and information. The Organization helps devel-oping countries and countries in transition modernize and improve agriculture, forestry and fisheries practices, ensur-ing good nutrition and food security for all. Since its found-ing, in 1945, FAO has focused special attention on develop-ing rural areas, home to 70 percent of the world’s poor and hungry people.
In Latin America and the Ca-ribbean, FAO has supported countries in building, assess-ing and implementing proj-ects, programs, policies and le-gal frameworks in the areas of food and agriculture. In Brazil, FAO supported the implemen-tation of the Zero Hunger Pro-gram and, in different coun-tries, it contributed to the drafting of laws on food secu-rity in national parliaments.
FAO’s main lines of work in the region are focused on strengthening family farming, promoting food and nutrition security and adaptation to climate change and fighting transborder diseases.
PROGRAMTHE bRAZiliAN ExPERiENcE

THE FOME ZERO (ZERO HUNGER)
PROGRAMTHE BRAZILIAN EXPERIENCE


THE FOME ZERO (ZERO HUNGER)
PROGRAMTHE BRAZILIAN EXPERIENCE
Editors:José Graziano da Silva
Mauro Eduardo Del GrossiCaio Galvão de França
Ministry of Agrarian DevelopmentBrasília, 2011

DILMA VANA ROUSSEFFPresident of the Republic
AFONSO FLORENCEMinister of State for Agrarian Development
MÁRCIA DA SILVA QUADRADODeputy Minister for Agrarian Development
CELSO LACERDAPresident of the National Institute for Colonization and Agrarian Reform
LAUDEMIR ANDRÉ MULLERSecretary for Family Farming
JERÔNIMO RODRIGUES SOUZASecretary for Territorial Development
ADHEMAR LOPES DE ALMEIDASecretary for Agrarian Reorganization
JOAQUIM CALHEIROS SORIANODirector of the Center for Agrarian Studies and Rural Development
JOÃO GUILHERME VOGADO ABRAHÃOAdvisor to the Center for Agrarian Studies and Rural Development
NEAD Special Series 13
Copyright 2011 MDAMINISTRY OF AGRARIAN DEVELOPMENT (MDA)www.mda.gov.br
NÚCLEO DE ESTUDOS AGRÁRIOS E DESENVOLVIMENTO RURAL (NEAD)(CENTER FOR AGRARIAN STUDIES AND RURAL DEVELOPMENT)SBN, Quadra 2, Edifício Sarkis Bloco D − loja 10 − sala S2ZIP CODE: 70040-910Brasília-Federal DistrictPhone: + 55 61 2020-0189 www.nead.gov.br
COORDINATING BOARD FOR COMMUNICATIONS AND EDITORIAL PRODUCTION Ana Carolina Fleury
REVISION AND PREPARATION OF ORIGINAL TEXTS IN PORTUGUESECecília Fujita
TRANSLATIONLuiz Marcos Vasconcelos
GRAPHIC DESIGN, COVER AND LAYOUTCaco Bisol
586fSilva, José Graziano da
The Fome Zero (Zero Hunger) Program: The Brazilian experience/ José Graziano da Silva; Mauro Eduardo Del Grossi; Caio Galvão de França (orgs.) ; – Brasília, 2010 : MDA, 2010. 360 pp.; 16 x 23 cm
NEAD Special Series 13
ISBN 978-85-60548-82-8
1. Hunger. 2. Zero Hunger Program Brazil. 3. Food Security. 4. Public Policy.5. Cash Transfer Program. I. Silva, José Graziano da. II. Del Grossi, MauroEduardo. III. França, Caio Galvão de. IV. Title.
CDD 353.53

303
13. PovERTy REDuCTIon: From 44 mIllIon to 29.6 mIllIon PeoPle
Mauro Eduardo Del Grossi
This chapter describes the evolution of poverty according to the poverty concept adopted by the Zero Hunger Program, with emphasis on family farming.
In the previous chapters, different public actions and poli-cies implemented under the Zero Hunger Program were reported and their evolution since the program was launched, in 2003, was described in detail. Obviously, poverty levels are not exclusively determined by policies directly implemented under the Zero Hun-ger Program, but also by the Brazilian macroeconomic conditions. However, since it its initial design stages, the program contemplat-ed structural policies of a macroeconomic nature, such as job and income generation policies, universal social security, minimum in-come, agrarian reform and incentives to family farming.
One of the main merits of the program was the fact that it combined different public policies, making it impossible to assess the impact of a specific action or of a set of actions. Therefore, the impact of the Zero Hunger Program will not be evaluated in this chapter, but rather the evolution of poverty among the Brazilian population according to the methodology adopted by the program. As pointed out in the diagnostic and design phase of the Zero Hun-ger Program, poverty rates in Brazil provide a strong indicator of the food and nutrition security of the Brazilian population.
deFInItIon oF the PoPulAtIon FACIng Food InseCurIty
To estimate its audience, the Zero Hunger Program devel-oped a methodology based on the poverty line (PL) as defined by the World Bank, of US$ 1.00 a day, adapted to Brazilian conditions. To take into account the effect of different costs of living in distinct Brazilian regions, the poverty line was regionalized based on rural areas of the northeast region and on cost-of-living differentials ob-

the BrAZIlIAn exPerIence
304
the Fome Zero (Zero hunger) ProgrAm
served in metropolitan areas, non-metropolitan urban areas, and rural areas in the other Brazilian regions. The weighted average poverty line for the population of each region was R$ 68.48 in 1999 figures, when this methodology was developed.
In addition to this regionalization exercise, the income of families indicating that part of the food they consumed came from their own agricultural production was adjusted. In total, the self-consumption percentage amounted to only 1.2% of the declared income of all families, although it represents a proportion of 17.3% of the families that declared to be “self-employed” in agricultural activities. Some items which account for “overhead costs,” such as rent and real estate installment payments, were deducted from the total household income of the families1.
Up till 2004, the National Household Sample Surveys (PNADs) carried out by the Brazilian Institute for Geography and Statistics (IBGE) did not cover rural areas in the states of Acre, Amazonas, Amapá, Pará, Roraima and Rondônia.
In 1999, the project estimated the number of poor people proportionally to the 2000 Demographic Census. Since 2004, the PNADs began to cover these states and for this work it used the per-centage of poor people observed in 2004 to estimate their number in 2001-2003, thus preserving their comparability with the original methodology.
Another detail of the methodology adopted by the Zero Hunger Project is that it excluded all families of employers from among poor people, i.e. it was considered that the few families of employers with a per capita income below the poverty line – about 70,000 families in 1999 – were likely to had under-reported their income, for which reason they were included in the group of non-poor families.
Using this methodology, the number of people facing food insecurity was calculated at 44 million:
The data suggest a potential audience of 44.043 million people belon-ging to 9.324 million families (1999). This poor population accounts for 21.9% of the families and for 27.8% of the country’s total population divided as follows: 19.1% of the population of metropolitan regions, 25.5% of the population of non-metropolitan urban areas, and 46.1% of the population of rural areas. In absolute figures, the results are as follows: 9.003 million, 20.027 million and 15.012 million people for each area of residence (Zero Hunger Project, 2001, p. 74).
1. For a full description of the methodology, see TAKAGI, GRAZIANO DA SILVA and DEL GROSSI, 2001.

305
evolutIon oF the Poverty levels untIl 2009
Let us now check what happened to poverty after the Zero Hunger Program was launched, in 2003, using the program’s origi-nal methodology. For this purpose, the same poverty line adopted by the 1999 National Household Sample Survey will be used, in-dexing the figures according to the INPC (National Consumer Price Index)2.The source of this information are the PNADs until the lat-est one available, carried out in 2009.
The results are shown in Graph 1: Brazil had 29.6 million people below the poverty line used by the Zero Hunger Program in 2009. The results also show that poverty continued to grow in Brazil until 2003, when the Zero Hunger Program began to be implemented. In 2003, the country was also facing a serious ex-change-rate and balance-of-payments crisis inherited from past ad-ministrations which pushed unemployment rates up. However, this trend was reverted as of 2003, when poverty levels began to drop continuously and sharply. Altogether, over 20 million people were removed from poverty between 2003 and 2009.
2. For more details on the methodology, see DEL GROSSI, GRAZIANO DA SILVA and TAKAGI, 2001
Poverty reductIon: From 44 mIllIon to 29.6 mIllIon PeoPle
Graph 1 – Number of poor people according to the criteria adopted by the Zero Hunger Program. Brazil, 1999-2009
70
60
50
40
30
20
10
0
4448 47 46
4337 35
31 29.6
50
1999 20092001 2002 2003 2004 2005 2006 2007 2008
In proportional terms, the poverty rate rose from 27.8% in 1999 to 28.1% in 2003, and then it dropped sharply to 15.4% in 2009 (Graph 2).

the BrAZIlIAn exPerIence
306
the Fome Zero (Zero hunger) ProgrAm
Table 1 – Evolution of poor people according to the criteria adopted by the Zero Hunger Program and location of the household. Brazil (thousand people)
1999Location Poverty
ratePoverty
ratePoverty
ratePoverty
rate PeoplePeoplePeople People
2003 2009Variation
2003/2009
Metropolitan 9.003 19.1% 12.208 22.0% 6.535 11.0% -5.673 -8.1%
Urban 20.027 25.5% 24.598 26.1% 14.864 14.4% -9.734 -11.2%
Rural 15.012 42.7% 13.299 45.4% 8.174 28.4% -5.125 -14.4%
Brazil 44.043 27.8% 50.105 28.1% 29.574 15.4% -20.531 -12.4%
Source: DEL GROSSI, based on the PNADs/IBGE.
Graph 2 – Evolution of the poverty rate according to the criteria adopted by the Zero Hunger Program. Brazil, 1999-2009
1999 20092001 2002 2003 2004 2005 2006 2007 2008
30%
25%
20%
15%
10%
5%
0%
POVE
RTY
RATE
The number of poor people decreased more sharply in urban areas, where almost 10 million people were removed from poverty (Table 1), followed by metropolitan regions, where a reduction of 5.6 million people was observed, and rural areas, with a reduction of 5.1 million people. Proportionally, however, the greatest reductions in pov-erty rates took place in rural areas, where they declined by over 14%.
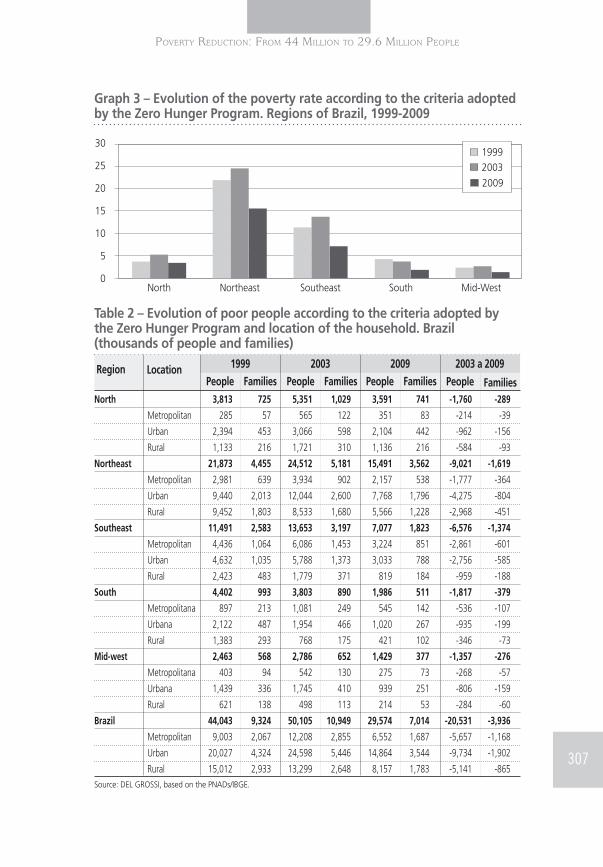
The northeast region was the one where the sharpest reduc-tion in the number of poor people was observed: 9 million people were removed from poverty between 2003 and 2009 (Table 2). The southeast region ranked second, with 6.5 million people removed from poverty (Graph 3), particularly in metropolitan areas, where a reduction of almost 2.9 million people was registered.
307
North 3,813 725 5,351 1,029 3,591 741 -1,760 -289
Metropolitan 285 57 565 122 351 83 -214 -39
Urban 2,394 453 3,066 598 2,104 442 -962 -156
Rural 1,133 216 1,721 310 1,136 216 -584 -93
Northeast 21,873 4,455 24,512 5,181 15,491 3,562 -9,021 -1,619
Metropolitan 2,981 639 3,934 902 2,157 538 -1,777 -364
Urban 9,440 2,013 12,044 2,600 7,768 1,796 -4,275 -804
Rural 9,452 1,803 8,533 1,680 5,566 1,228 -2,968 -451
Southeast 11,491 2,583 13,653 3,197 7,077 1,823 -6,576 -1,374
Metropolitan 4,436 1,064 6,086 1,453 3,224 851 -2,861 -601
Urban 4,632 1,035 5,788 1,373 3,033 788 -2,756 -585
Rural 2,423 483 1,779 371 819 184 -959 -188
South 4,402 993 3,803 890 1,986 511 -1,817 -379
Metropolitana 897 213 1,081 249 545 142 -536 -107
Urbana 2,122 487 1,954 466 1,020 267 -935 -199
Rural 1,383 293 768 175 421 102 -346 -73
Mid-west 2,463 568 2,786 652 1,429 377 -1,357 -276
Metropolitana 403 94 542 130 275 73 -268 -57
Urbana 1,439 336 1,745 410 939 251 -806 -159
Rural 621 138 498 113 214 53 -284 -60
Brazil 44,043 9,324 50,105 10,949 29,574 7,014 -20,531 -3,936
Metropolitan 9,003 2,067 12,208 2,855 6,552 1,687 -5,657 -1,168
Urban 20,027 4,324 24,598 5,446 14,864 3,544 -9,734 -1,902
Rural 15,012 2,933 13,299 2,648 8,157 1,783 -5,141 -865
Table 2 – Evolution of poor people according to the criteria adopted by the Zero Hunger Program and location of the household. Brazil (thousands of people and families)
LocationRegionFamiliesFamiliesFamiliesFamilies PeoplePeoplePeoplePeople
Source: DEL GROSSI, based on the PNADs/IBGE.
1999 2003 2009 2003 a 2009
Poverty reductIon: From 44 mIllIon to 29.6 mIllIon PeoPle
Graph 3 – Evolution of the poverty rate according to the criteria adopted by the Zero Hunger Program. Regions of Brazil, 1999-2009
North Northeast Southeast South Mid-West
30
25
20
15
10
5
0
1999
2003
2009

the BrAZIlIAn exPerIence
308
the Fome Zero (Zero hunger) ProgrAm
FAmIly FArmIng
As mentioned in the preceding chapters, the Zero Hunger Program was organized around four axes: access to food products, strengthening of family farming, income generation, and social ar-ticulation, mobilization and control. The project was designed to increase local food production while providing incentives to family farmers, traditional suppliers of food to the poor population:
A key consideration of the Zero Hunger Project is the need to resume an agricultural policy in Brazil capable of providing true incentives to family farming with the aim of increasing food production and ensu-ring better protection to low-income farmers. This can be achieved through a set of policies that combine: agricultural income insurance; priority to domestic production, relying on imports only when there are harvest failures; incentives to public research to make it possible for small farmers to use appropriate technologies, in combination with an effective technical assistance policy; an effective credit po-licy linked to the development of marketing channels; incentives to setting up cooperatives to protect nature and the landscape, among other measures (Zero Hunger Project, p. 87).
Apart from implementing public policies intended to increase the purchasing power of the poorest population segments, it was necessary to break the vicious circle of hunger by providing incen-tives to family farming, which apart from producing basic food items can create local virtuous cycles in terms of occupation and income.
Some figures will now be presented3 to show the importance and dimensions of family farming in Brazil. In 2006, the last Agricul-ture/Livestock Census carried out by IBGE indicated that there were 5,175,489 agricultural/livestock establishments in Brazil in that year, 4,367,902 of which were identified as belonging to family farmers4, meaning that they account for 84% of all Brazilian agricultural/live-stock establishments (Table 3). Despite their numerical importance, they occupy an area of a little over 80 million hectares, equivalent to 24% of the area occupied by all establishments. Although they ac-count for only 16% of all establishments, non-family establishments occupy 76% of the areas occupied by all of them. 3.Based on FRANÇA, DEL GROSSI and MARQUES, 2009.
4. According to the criteria of Law n. 11,326 of 2006, which defines the category of family farmers in Brazil.

309
Table 3 – Characterization of agricultural/livestock establishments according to the classification of family farming provided for in Law n. 11,326. Brazil, 2006
FeaturesFamily Farming Non-Family Farming
Value Value% %
Number of establishments 4,367,902 84% 807,587 16%
Area (million ha) 80.3 24% 249.7 76%
Labor (million people) 12.3 74% 4.2 26%
Production value (R$ billion) 54.4 38% 89.5 62%
Revenue (R$ billion) 41.3 34% 80.5 66%
Source: DEL GROSSI and MARQUES, 2010.
Almost three-fourths of all occupied people in rural areas (a little over 12 million people) work in family establishments, while only 4.2 million people work in non-family establishments. The significant use of labor in family establishments shows their impor-tance in terms of generating occupations in rural areas.
Although they occupy only 24% of the area, family establishments account for 38% of the gross production value and for 34% of all revenues in rural areas. Family farming generates R$ 677/ha and non-family farming generates only R$ 358/ha. Family farming is also more labor-intensive: it occupies more than 15 people per each 100 ha, while non-family farming occupies less than 2 people per 100 ha (DEL GROSSI and MARQUES, 2010, p. 16).
The indicators mentioned above indicate that family estab-lishments make better and more intensive use of the land. Family farming is also a direct supplier of food items typically consumed in Brazil: it accounts for 87% of all the cassava, 70% of all the beans, 46% of all the corn, 34% of all the rice, 59% of all the pork, 50% of all the poultry, 30% of all the beef and 58% of all the milk produced in the country. The results show the strategic role played by family farming in guaranteeing food and nutrition security for the Brazilian population.
Considering the dimensions of family farming in the country, the need to involve it in the Zero Hunger Program was obvious. Let us now consider the evolution of public policies designed to strengthen family farming in Brazil.
Poverty reductIon: From 44 mIllIon to 29.6 mIllIon PeoPle

the BrAZIlIAn exPerIence
310
the Fome Zero (Zero hunger) ProgrAm
NATIONAL PROGRAM FOR THE STRENGTHENING OF FAMILY FARMING (PRONAF)5
This is the largest and most comprehensive action in sup-port of family farmers in Brazil, through which agricultural and non-agricultural credit is granted to them at low interest rates. Since 2003, more than 10 million credit contracts were signed and R$ 52 billion were made available for agricultural credit, ac-counting for 85% of all funds earmarked for the Pronaf since it was launched.
INCOME AND CLIMATE INSURANCE FOR FAMILY FARMING
Most of the Pronaf operations are supported by the Price Guarantee Program for Family Agriculture (PGPAF), which ensures a discount in financing contracts proportionally to drops in prices during the harvest marketing season. This covers 35 products at the moment, and the discounts can be as high as R$ 5,000 per farmer. Considering that the PGPAF is linked to marketing prices, this program is essentially an income guarantee program in credit operations involving family farmers. It has been applied to 500,000 contracts per harvest in average, granting an average discount of R$ 1.2 thousand in Pronaf contracts.
Since the 2004-2005 harvest, losses caused by climatic events have been in turn covered by the Family Farming Insurance (Seaf), which apart from ensuring the settlement of loans granted under Pronaf also makes available an additional 65% of the net revenue expected from the undertaking in question. The scheme ensures that farmers will not become indebted and that they will also have an income to make ends meet until the following har-vest. The insurance scheme also involves technical assistance to manage risks in family farming and the promotion of appropriate technologies, such as the adoption of preventive measures against adverse agro-climatic events. This climate insurance is only applied to agricultural defrayal contracts, protecting 600,000 contracts per harvest in average, but there are plans to extend it to investment contracts as well. 5. For more details, see the chapter by PERACI and BITTENCOURT.

311
FAMILY AGRICULTURE FOOD ACQUISITION PROGRAM (PAA)
Implemented in 2003, this program has a twofold objective: stimulate food production by family farmers and the establishment of food stocks and schemes for distributing food to people facing food insecurity. The products are also distributed to schools, hospi-tals and charities.
HARVEST INSURANCE
This is an action designed to protect farmers in the Brazil-ian semi-arid region when adverse climatic events occur. For this purpose, a fund (the Harvest Insurance Fund) was established with the participation of the federal, state and municipal governments which is relied upon when catastrophes caused by droughts or ex-cessive rains hit and cause losses exceeding 50% in corn, bean, cotton, rice and cassava crops of family farmers in the Brazilian semi-arid region. The Fund ensures a payment of R$ 550.00 to each affected family as financial support until the next harvest.
other PolICIes In suPPort oF rurAl develoPment
Although they are not part of the Zero Hunger strategy, other policies intended to promote sustainable rural development are worth mentioning at this point. Among them, the following ones stand out for their timeliness and relevance:
AGRARIAN REFORM
Despite Brazil’s continental dimensions, inequalities in land distribution are a heritage of its territorial occupation model. The Gini index for land distribution among agricultural/livestock estab-lishments amounted to 0.854 in 2006. Analyzing agricultural/live-stock establishments by size, one sees that 47,000 (5%) of them have areas of 1,000 ha or more and occupy 146 million hectares (44% of the total area), while the establishments with less than 100 ha total 4.4 million (86%) and occupy less than 71 million hectares (21% of the total area). Agrarian reform policies were thus devised to reduce these disparities and strengthen family farming.
Poverty reductIon: From 44 mIllIon to 29.6 mIllIon PeoPle

the BrAZIlIAn exPerIence
312
the Fome Zero (Zero hunger) ProgrAm
In the period between 2003 and 2009, 574,532 families were settled in over 47.7 million hectares under 3,386 projects that account for approximately 62% of all settlements established in the past 39 years. For these results to be achieved, R$ 7 billion were invested in the past seven years in buying land, apart from other investments.
A Land Credit policy is another element of the national agrar-ian reform plan, the purpose of which is granting long-term loans to family farmers for them to either buy land or increase their ar-eas. Between 2003 and 2009, 74,000 families were granted loans amounting to R$ 1.9 billion to buy 1.3 million hectares.
LEGAL LAND PROGRAM IN THE LEGAL AMAZON REGION
Launched in June 2009, this program is aimed at regularizing the occupation of federal public lands located in the Legal Amazon region and at promoting territorial organization in the region. Land occupation in the Legal Amazon region is characterized by pre-carious or no legal recognition, giving rise to land conflicts often marked by violence. There were 58 million hectares (11% of the Legal Amazon region) of federal land not set apart for any specific purpose in the region, with approximately 158,000 occupations to be regularized in these areas.
The implementation of the Legal Land Program was provided for in Law n. 11,952/2009, which simplified procedures for regular-izing the occupation of federal land in the Legal Amazon region for areas with up to 1,500 hectares. Almost 4.5 million hectares of land occupied by more than 26,000 people have been regularized already in 261 municipalities. The first title deeds to land granted under the program have benefited 270 occupants already.
In addition to the need to regularize the situation of the farm-ers who occupy these areas, about 170 municipalities are located in urban areas fully included in non-regularized federal land, mak-ing it difficult to charge taxes and provide services to their dwellers. These areas will be transferred to the municipalities, which in turn will regularize the real property titles of their inhabitants.
TECHNICAL ASSISTANCE AND RURAL EXTENSION
The provision of Technical Assistance and Rural Extension
313
(Ater) services is key for public policies to benefit communities and rural establishments. In the 1990s, the Rural Extension System was almost completely dismantled and was only preserved in some states of the country. In 2003, the technical assistance and rural extension policy was resumed, expanded and improved. Between 2003 and 2009, approximately R$ 1.5 billion were invested to as-sist 2.5 million families. Currently, there are 548 organizations reg-istered with the Ministry of Agrarian Development (MDA) that pro-vide technical assistance and rural extension services with a staff of 23,000 technical experts in all the Brazilian states.
THE “TERRITORIES OF CITIZENSHIP” PROGRAM6
Launched in February 2008, the Territories of Citizenship Pro-gram (PTC) is focused on addressing poverty in rural areas through a sustainable territorial development strategy. For this purpose, the program is based on plans developed in areas defined as territories and relies on the participation of civil society to try and integrate the actions of the federal administration and of state and municipal governments. In 2009, the program covered 120 territories in all the units of the federation, comprising 1,852 municipalities and 13.1 million people in rural areas, who account for 46% of all the Brazilian rural population, 67% of all people settled under the agrarian reform program, 66% of all Quilombo communities, 52% of all indigenous lands, 54% of all fishermen and 46% of all families of family farmers of Brazil. At federal level, the joint effort of agencies and organizations made it possible to structure, in 2009, a matrix of 200 governmental actions to be carried out in the 120 territories with funds amounting to R$ 24.6 billion, including some of the actions contemplated in the Zero Hunger strategy mentioned above. In 2010, an additional R$ 27 billion will be invested in these actions.
evolutIon oF Poverty In rurAl AreAs
Considering the rural development policies mentioned above, let us now check the situation of rural families.
This text uses only two indicators: the poverty rate and the household income composition.
Poverty reductIon: From 44 mIllIon to 29.6 mIllIon PeoPle
6. For more details, see the chapter by França.

the BrAZIlIAn exPerIence
314
the Fome Zero (Zero hunger) ProgrAm
It was mentioned above that over 5 million people were re-moved from poverty in rural areas, in which the most significant drop in poverty rates was observed. But was this poverty reduction homogeneous in all rural segments?
With the aim of understanding the dynamic of rural areas, the population living in rural areas and part of the urban popula-tion engaged in agricultural activities were considered7. For this purpose, economically active families were classified under the fol-lowing categories:
Family farming: comprises families engaged in an agricul-tural undertaking, whether they own land or not, living in an urban or rural area. According to the Pronaf rules, these families can hire up to two permanent employees.
Industrial farming: families with access to an agricultural undertaking with three or more permanent employees liv-ing in an urban or rural area.
Non-rural agricultural families: families of employers or self-employed people whose members are engaged in non-agricultural activities although they live in a rural area.
Rural wage-earners: families that live off the labor of their members. For simplification purposes, both agricultural wage-earners (living in an urban or rural area) and non-agri-cultural wage-earners living in a rural area were considered.
The results of this classification can be seen in table 4. A sig-nificant poverty reduction was observed among the families of fam-
7. Agricultural activities refer to the generic meaning of the term and include livestock, extractivism, forestry and fishing activities.
2003 20032009 2009Difference Difference
Number of peopleNumber of peopleType of families
Family farming 7,709 3,570 -4,139 1,504 746 -759
Industrial farming 0 0 0 0
Non-agricultural rural families1 998 575 -423 198 129 -69
Rural wage-earners2 7,855 4,662 -3,193 1,585 960 -624
1. Includes families of employers and of self-employed, non-agricultural or pluriactive workers.2. Includes agricultural and pluriactive families (in rural or urban areas) and non-agricultural families living in rural areas. Note: does not includes rural families in the states of Acre, Amazonas, Amapá, Pará, Rondônia and Roraima, which only began to be counted as of 2004.
Table 4 – Agricultural families or occupied rural families, according to their poverty status. Brazil (thousands of families or people)

315
ily farmers: 759,000 of them were removed from poverty. In terms of number of people, this reduction amounted to over 4 million people, which represents a drop from 41% to 24% in this group’s poverty rate. This is the occupational category for which the sharp-est reduction in the number of poor people was registered.
The second category that experienced a significant drop in the number of poor was that of rural wage-earners, in which over 3 mil-lion people from 624,000 families were removed from poverty be-tween 2003 and 2009. Despite a major reduction in the number of poor people in general, rural wage-earners account for the majority of poor people in Brazilian rural areas, with a little less than 1 million poor families, representing 20% of all families of rural wage-earners.
When sources of income for the different types of families are broken down, a significant increase in labor income is observed (Ta-ble 5). In family farming, the average agricultural income increased by R$ 107.00, representing a real gain of 17%, and non-agricultural income grew by R$ 102.00 in average (real gain of 43%).
200320032003 200920092009 DifferenceDifferenceDifference
Average household income
Average non-agricultural income
Average agricultural incomeType of families
Family farming 620 727 17% 239 341 43% 1,138 1,499 32%
Industrial farming 7,528 7,249 -4% 1,213 1,513 25% 9,737 10,477 8%
Non-agricultural rural families1 - - 978 1,172 20% 1,230 1,526 24%
Rural wage-earning families2 322 396 23% 317 460 45% 793 1,094 38%
1. Includes families of employers and self-employed, non-agricultural or pluriactive workers.2. Includes agricultural and pluriactive families (in rural or urban areas) and non-agricultural families living in rural areas. Note: does not includes rural families in the states of Acre, Amazonas, Amapá, Pará, Rondônia and Roraima, which only began to be counted as of 2004. Figures indexed by the INPC index.Source: Figures of National Household Sample Surveys processed by the author.
Poverty reductIon: From 44 mIllIon to 29.6 mIllIon PeoPle
The increase observed in agricultural and non-agricultural in-come accounted for 58% of the total increase in the family farming income, i.e. the increase in incomes of all categories (labor income and governmental cash transfers – retirement pensions and Bolsa Família program) played a major role in promoting a significant reduction in poverty among family farmers, but labor income was the one that contributed the most to increasing the income of these farmers’ families.
Table 5 – Average monthly household income from agricultural and non-agricultural activities, according to the family type. Brazil (amounts in R$ in September 2009)

the BrAZIlIAn exPerIence
316
the Fome Zero (Zero hunger) ProgrAm
Table 5 also shows that both the agricultural (23%) and non-agricultural (45%) income of rural wage-earners increased in real terms. These two sources explain 72% of the increase observed in the income of families of wage-earners, but because rural agri-cultural wages are very low historically, even the average increase of R$ 74.00 in agricultural income and of R$ 143.00 in non-agri-cultural income were not sufficient to remove more wage-earning families from poverty.
The fact that the labor income of rural families was the one that increased most shows that they experienced virtuous cycles of occupation, job and income generation. These results strongly sug-gest that the assumption of the Zero Hunger Program was correct: cash transfer programs such as the Bolsa Família program were important and played a major role in enhancing demand in local markets, boosting economies that were stagnated before.
FInAl ConsIderAtIons
This paper described the evolution of poverty and, conse-quently, of food and nutrition security according to the criteria ad-opted by the Zero Hunger Program. Between 2003 and 2009, over 20 million people were removed from poverty, particularly in rural areas, where 5 million people found a way out of it.
Since it was launched, in 2003, the program required intense efforts from the government to break the vicious circle of hunger and poverty. The figures for the different programs implemented over recent years showed that these efforts were continuous and consistent with their initial objectives.
The combination of different cash transfer policies (emer-gency policies) to boost local consuming markets and stable mac-roeconomic conditions ensured positive results, as observed in Brazil’s rural areas.
In the family farming sector, over 4 million people have crossed the poverty line upward. Among rural wage-earners, 624,000 families were removed from poverty, but 17% of the wage-earning families are still below the poverty line.
Among income sources, the income from agricultural and non-agricultural work was the one that accounted for most of the increase observed in the income of family farmers and rural wage-
317
earners. The support provided to family farming and local develop-ment, combined with cash transfers, generated virtuous cycles of in-come generation and assured citizenship rights locally. The increase observed in labor income confirms this positive performance.
Obviously, despite the advances registered since 2003, many challenges still remain, and perhaps the greatest one lies in the fact that 29.5 million people are still considered poor in Brazil.
reFerenCes
BRAZIL. Inauguration speech of President Lula, on January 1, 2003. Available at: <http://www.info.planalto.gov.br/>. Accessed on: October 10, 2010.
___. Presidency of the Republic. Fome Zero. Available at: <http://www.fomezero.gov.br/>. Accessed on: October 10, 2010.
___. President (2003 – L. I. Lula da Silva). Message to the National Congress, 2010. 422 pp. (Document of the Presidency of the Republic).
DEL GROSSI, M. E.; GRAZIANO DA SILVA, J.; TAKAGI, M. Evolução da pobreza no Brasil, 1995/99. Campinas: Unicamp, IE, 2001. (Discussion paper n. 104).
DEL GROSSI, M. E.; MARQUES, V. A. A delimitação da agricultura familiar no Censo Agropecuário 2006 segundo a Lei 11.326. [In the press].
FRANÇA, C. G.; DEL GROSSI, M. E.; MARQUES, V. A. O Censo Agropecuário 2006 e a agricultura familiar no Brasil. Brasília: Ministry of Agrarian Development, 2009.
IBGE. National Household Sample Surveys - PNAD. Rio de Janeiro, 2002 and 2008. Available at: <www.ibge.gov.br> [link “População”]. Accessed on: October 10, 2010.
CITIZENSHIP INSTITUTE. Projeto Fome Zero: uma proposta de política de segurança alimentar para o Brasil. São Paulo, 2001. Version 3. 118 pp.
Poverty reductIon: From 44 mIllIon to 29.6 mIllIon PeoPle

the BrAZIlIAn exPerIence
318
the Fome Zero (Zero hunger) ProgrAm
TAKAGI, M.; GRAZIANO DA SILVA, J.; DEL GROSSI, M. E. Pobreza e fome: em busca de uma metodologia para quantificação do problema no Brasil. Campinas: Unicamp, IE, 2001. (Discussion paper n. 101).