abordagem de risco e perigosidade experiência · iniciativa riscos ciclo de encontros: ......
TRANSCRIPT

Abordagem de Risco e Perigosidade – Experiência
de projeto Europeu “ESPON-HAZARDS”
Maria João Batista, LNEG
CICLO DE ENCONTROS CIENTÍFICOS A Ciência na Prevenção e Mitigação dos Riscos em Portugal RISCOS TECNOLÓGICOS Fundação Calouste Gulbenkian

Iniciativa Riscos Ciclo de Encontros: RISCOS TECNOLÓGICOS Fundação Calouste Gulbenkian, 23-05-2013
Project 1.3.1 (2004-2006)
The spatial effects and management of natural and technological hazards in general and in relation to
climate change
Consórcio:
Institute of Spatial Planning (IRPUD), Germany Center for Urban and Regional Studies/Helsinki University of Technology (CURS/HUT), Finland Institute of Ecological and Regional Development (IOER), Germany Swedish Meteorological and Hydrological institute (SMHI), Sweden Comissão de Coordenação e Desenvolvimento Regional do Centro (CCDRC), Portugal Instituto Nacional de Engenharia, Tecnologia e Inovação, I.P. (INETI), Portugal

Iniciativa Riscos Ciclo de Encontros: RISCOS TECNOLÓGICOS Fundação Calouste Gulbenkian, 23-05-2013
Objectivo: Definição de tipologias de riscos naturais e tecnológicos na Europa e em algumas regiões. Definição do perfil de risco das regiões
NUTS III na Europa
Naturais •Avalanches
•Seca Potencial
•Sismos
•Temperaturas extremas
•Cheias
•Fogos florestais
•Deslizamentos
•Tempestades
•Tempestades com oscilação do nível do mar na costa(Storm surges)
•Tsunamis
•Actividade vulcânica
Tecnológicos •Tráfego aéreo •Perigo de acidente industrial (industria química) •Perigo de acidente em central nuclear •Transporte, manuseamento e armazenamento de petróleo
Indicadores de Vulnerabilidade
Metodologia:
Perigosidade

Iniciativa Riscos Ciclo de Encontros: RISCOS TECNOLÓGICOS Fundação Calouste Gulbenkian, 23-05-2013
Metodologia:
Método Delphi
Risco=Perigosidade potencial x vulnerabilidade
“Peso” dos riscos dado por grupos de especialistas usado para definição do perfil de risco da região

Iniciativa Riscos Ciclo de Encontros: RISCOS TECNOLÓGICOS Fundação Calouste Gulbenkian, 23-05-2013

Introduction
• The Central Region of Portugal:
– 25.7% of the Portuguese land area
– 78 municipalities
– almost 1.8 million inhabitants (17.2% of the national total )
– 10 NUTs III level areas
ESPON HAZARDS

Natural and technological hazards in the planning of Centre region
ESPON HAZARDS
Natural and
technological hazards
spatial
relevance
Natural hazards
Floods
+
Landslides/ avalanches
Rock collapses
Landslides
0
0
Earthquakes
0
Droughts
+
Forest fires spacialy in Pinhal Interior Nut III
(Inland region)
+
Storms
wind storms
+
Extreme precipitation (heavy rainfall and hail)
+
Extreme temperatures (heat waves)
0
Technological Hazards
Hazards from nuclear power plants
0
Hazards from hazardous storage of nuclear waste
Old uranium mines
+
dam failure
+
Hazards from other sources
0

Hazards from hazardous waste deposits
Uranium contamination hazard
ESPON HAZARDS

Methodology development
Driving forces
Number of mines/NUTSIII
Pressure State
Number of water systems/NUTSIII
Impact Response
DPSIR
Population density (50%) GDP(50%)
Degree of Vulnerability
ESPON HAZARDS
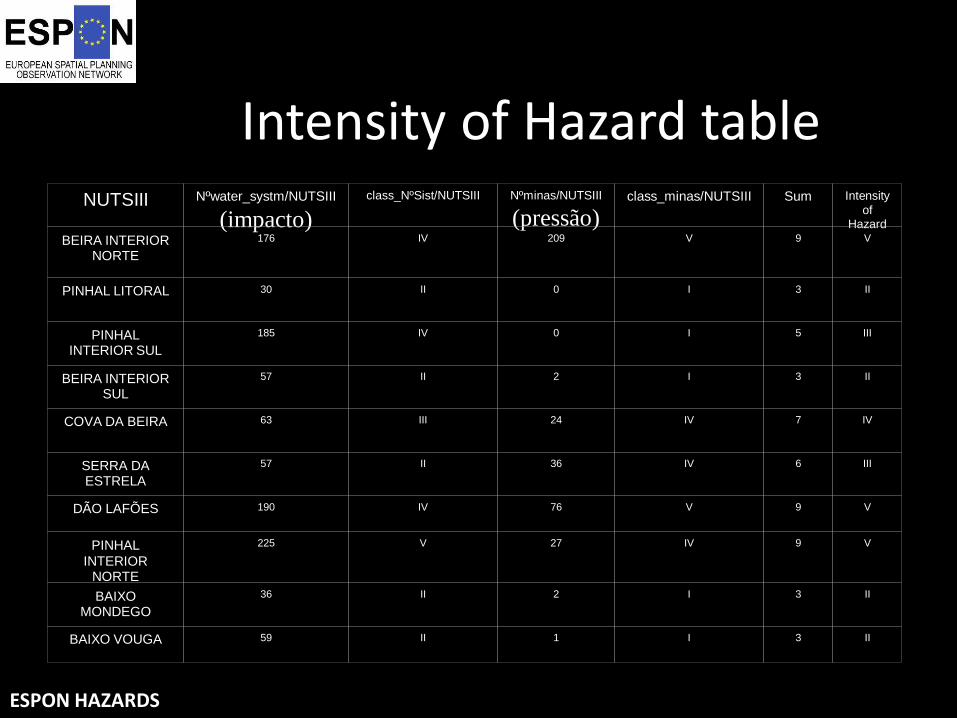
Intensity of Hazard table NUTSIII
Nºwater_systm/NUTSIII
(impacto)
class_NºSist/NUTSIII
Nºminas/NUTSIII
(pressão) class_minas/NUTSIII
Sum
Intensity
of Hazard
BEIRA INTERIOR NORTE
176
IV
209
V
9
V
PINHAL LITORAL
30
II
0
I
3
II
PINHAL
INTERIOR SUL
185
IV
0
I
5
III
BEIRA INTERIOR
SUL
57
II
2
I
3
II
COVA DA BEIRA
63
III
24
IV
7
IV
SERRA DA ESTRELA
57
II
36
IV
6
III
DÃO LAFÕES
190
IV
76
V
9
V
PINHAL
INTERIOR NORTE
225
V
27
IV
9
V
BAIXO MONDEGO
36
II
2
I
3
II
BAIXO VOUGA
59
II
1
I
3
II
ESPON HAZARDS

ESPON HAZARDS
Damage Potential

ESPON HAZARDS
Coping capacity

Aggregated risk map for Nuts III
ESPON HAZARDS
Further detail methodology development
ESPON HAZARDS – Coimbra meeting
Methodology applied to data
available of regional vulnerability
indicators Damage potential
Coping capacity
NUTS IV
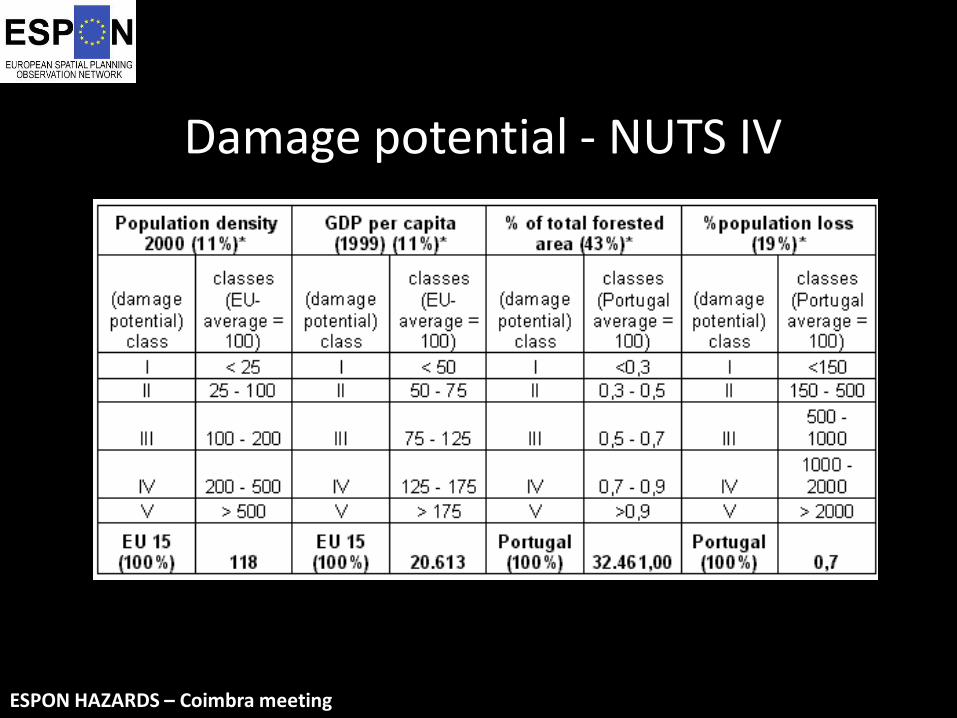
Damage potential - NUTS IV
ESPON HAZARDS – Coimbra meeting

Coping capacity - NUTS IV
ESPON HAZARDS

ESPON HAZARDS
Águeda (Ag), Albergaria-a-Velha (AV), Anadia (An), Aveiro (Av), Estarreja (Es), Ílhavo (Il), Mealhada (Mea), Murtosa (Mur), Oliveira do Bairro (OB), Ovar
(O), Sever do Vouga (SV), Vagos (Vg), Cantanhede (Can), Coimbra (Coi), Condeixa-a-Nova (CN), Figueira da Foz (FF), Mira (Mi), Montemor-o-Velho
(MV), Penacova (Pen), Soure (Sou), Batalha (B), Leiria (Lei), Marinha Grande (MG), Pombal (Pb), Porto de Mós (PM), Alvaiázere (Az), Ansião (Ans),
Arganil (Arg), Castanheira de Pêra (CP), Figueiró dos Vinhos (FV), Góis (G), Lousã (Lou), Miranda do Corvo (MC), Oliveira do Hospital (OH), Pampilhosa
da Serra (PS), Pedrogão Grande (PG), Penela (Pen), Tábua (T), Vila Nova de Poiares (VNP), Aguiar da Beira (AB), Carregal do Sal (CS), Castro Daire
(CD), Mangualde (Mag), Mortágua (Mor), Nelas (N), Oliveira de Frades (OF), Penalva do Castela (PC), Santa Comba Dão (SCD), São Pedro do Sul
(SPS), Sátão (Sa), Tondela (Ton), Vila Nova de Paiva (VNPa), Viseu (Vis), Vouzela (Vz), Mação (Mac), Oleiros (Ol), Proença-a-Nova (PN), Sertã (Ser),
Vila de Rei (VR), Fornos de Algodres (FA), Gouveia (Gou), Seia (S), Almeida (Alm), Celorico da Beira (CB), Figueira de Castelo Rodrigo (FCR), Guarda
(Gua), Manteigas (Man), Meda (Med), Pinhel (Pi), Sabugal (Sb), Trancoso (Tra), Castelo Branco (CaB), Idanha-a-Nova (IN), Penamacor (Pnm), Vila
Velha de Rodão (VVR), Belmonte (Bel), Covilhã (Cov), Fundão (Fun)
Aggr.
Hazard potential
Degree of vulnerability
I II III IV V
I 2 3 4 5 6
II
3 AV, Av, Es, Il, Mea, Mur, OB, O,
SV, Vg Coi, CN, Mi, MV, B, MG,
PM, Az, Ans, CP, Lou, MC, VNP,
AB, CS, Mag, N, OF, SCD, SPS,
VNPa, FA, Alm, Gou, FCR,
Gua, Med, Pin,
4 Ag, An, Can, FF,Pen, Lei,
Sou, Arg, FV, G, OH, PG,
Pen, T, CD, Mor, PC, Sa,
Ton, Vis, Vz, VR, S, CB,
Man, Sb, Tra, VVR, Bel,
Cov,
5 Pb PS, Mac, PN,
Ser, CaB, Pnm,
Fun
6 Ol, IN,
7
III 4 5 6 7 8
IV 5 6 7 8 9
V 6 7 8 9 10
Hazards Vulnerability Table

Aggregated risk map for Nuts IV
ESPON HAZARDS

ESPON HAZARDS
Further detail development of the methodology
Advanced Research Workshop

Uranium Mines
• The Central Region of Portugal has:
– a large quantity of U mineral occurrences identified (465)
– a large quantity of abandoned U mine sites (60)
• About 75% open pits
• About 25% underground mining operations

Using Municipality unit
Hazard Potential + Vulnerability

Hazard Potential

Risk
Hazard Potential Vulnerability Number of mines per municipality
Water systems per municipality
Inhabitants per water system
Methodology
Vol. Waste + type exploration + leaching + acid water

Hazard Map Number of water systems per
municipality
Calculation
Class
PF
<10
10 –30
>30
1
2
3
Mu
ltiplicatio
n facto
r of 1
PF-ponderation factor

Hazard Map Number of mineral occurrences per
municipality
Calculation
Class
PF
<10
10 – 30
>30
1
2
3
Mu
ltiplicatio
n facto
r of 1
PF-ponderation factor

Hazard Map Number inhabitants per water system
per municipality
Calculation
Class
PF
<5000
5000 – 20000
>20000
1
2
3
Mu
ltiplicatio
n facto
r of 1
PF-ponderation factor

Hazard Map Volume of waste + mine type + leaching
+ acid water per municipality
Calculation
Class
PF
Low volume of
waste+underground
mine+no leaching+no acid water
Medium
High volume
of waste+open
pit+leaching+acid water
1
2
3
Mu
ltiplicatio
n facto
r of 1
PF-ponderation factor

Vulnerability

Methodology
Regional Vulnerability
Damage potential
indicators
Coping capacity
indicators
Regional GDP/ capita National GDP/ capita
Population density Nºdoctors/1000 inhab
Risk
Hazard Potential Vulnerability
Economic and Social indicators

Population density per municipality
Calculation
Class
PF
1
2
3
Mu
ltiplicatio
n facto
r of 1
<25 25-100 >100
PF-ponderation factor

Regional GDP per capita per municipality
Calculation
Class
PF
1
2
3
Mu
ltiplicatio
n facto
r of 1
<25 25-100 >100
PF-ponderation factor

National GDP per capita per municipality
Calculation
Class
PF
1
2
3
Mu
ltiplicatio
n facto
r of 1
<25 25-100 >100
PF-ponderation factor

Doctors per 1000 inhabitants per
municipality
Calculation
Class
PF
1
2
3
Mu
ltiplicatio
n facto
r of 1
>4 2-4 <2
PF-ponderation factor
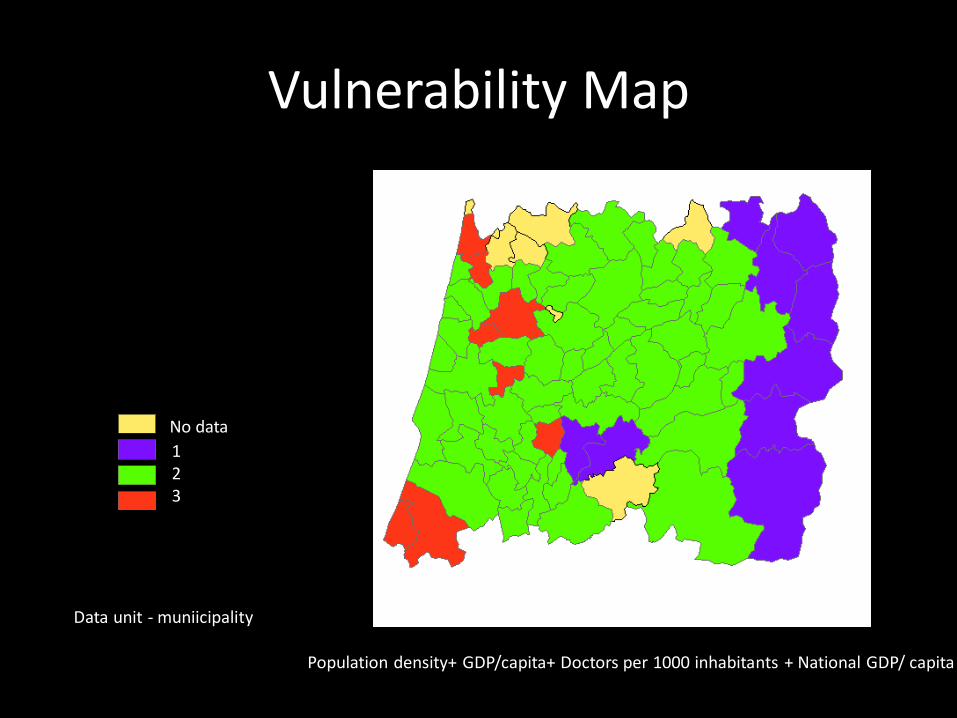
Vulnerability Map
Legend
0
1
2
3
No data
1 2 3
Population density+ GDP/capita+ Doctors per 1000 inhabitants + National GDP/ capita
Data unit - muniicipality

Hazard Potential +
Vulnerability

Risk Map
Legend
0
1
2
3
No data
1 2 3
Hazard potential + Vulnerability = Risk map of Uranium contamination
Data unit - muniicipality

Conclusions • Higher risk municipalities have
open pit uranium mines with acid
mine drainage, high volumes of
waste materials and medium
population density, GDP/capita and
less doctors per 1000 inhabitants.
• These municipalities are Gouveia,
Guarda, Mangualde.

ESPON HAZARDS
Further detail development of the methodology

Hazard Maps
(unit classification 100x100m)

Methodology
Risk
Hazard Potential Vulnerability Land use
Lithology
Distance of U mines to land use categories
Geoaccumulation index indicator
Natural Gamma Ray
Water systems per municipality
Inhabitants per water system
Volume of waste / U exploration


The Centre Iberian autochthon outcrops are mainly from the Supergrupo Dúrico Beirão made by a thick sequence of turbidites, deposited in a talus environment on late Neoproterozoic to Cambrian ages. The Supergrupo Dúrico-Beirão is made by a metamorphosed sequence of pelites, phylites, conglomerates, quartzites, among others, which lies unconformebly
on the Pre-Cambrian subtract. From
Devonian to Permian ages, the Variscan orogeny was responsible for the NW-SE folding on the Supergrupo Dúrico-Beirão, and for the ductile shears and regional metamorphism that reached the green schist facies.
The Centre Iberian granites were implanted along the directions of the ductile shears of the Variscan last deformation phase, originating an intense contact metamorphism.

ESPON HAZARDS
Lithology

Natural Gamma Ray exposure rate

Land cover
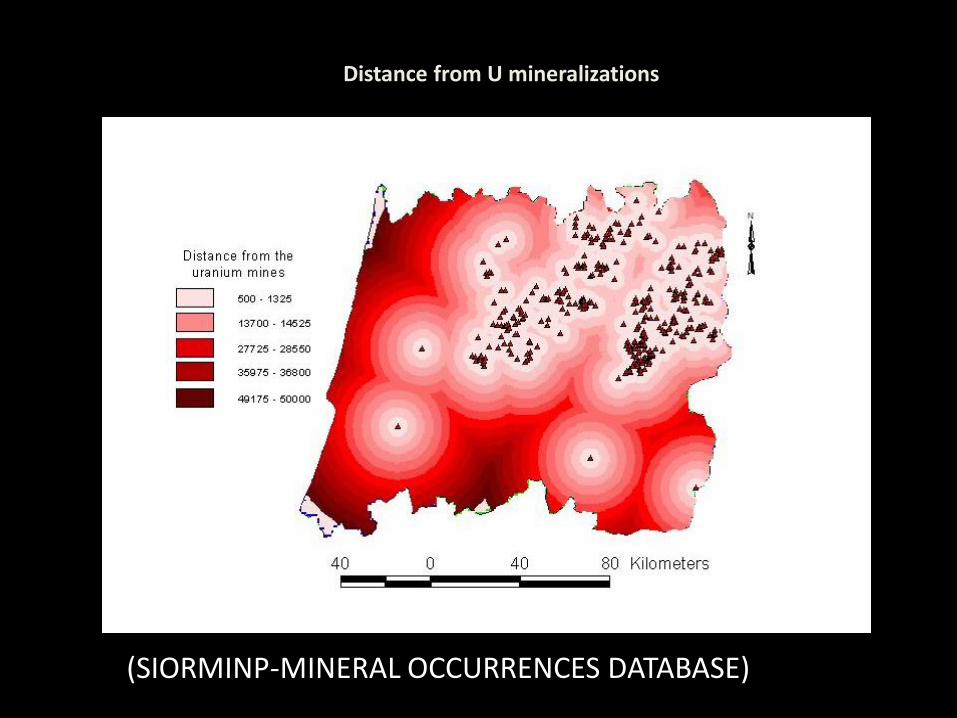
(SIORMINP-MINERAL OCCURRENCES DATABASE)
Distance from U mineralizations

U Geoaccumulation index in stream sediments

IIgeo= log 2 [Cn / 1,5 x Bn ]
Cn= chemical element concentration n in fine-grained
sediments
Bn= geochemical background from clay fraction
sediments (average value in clays); the 1,5 factor was
calculated by the authors to prevent lithological changes in
the background values.

Igeo(class)
Geoacumulation Index
Pollution degree
6
>5
Very Strong Pollution
5
>4-5
Strong to Very Strong Pollution
4
>3-4
Strong Pollution
3
>2-3
Moderate to Strong Pollution
2
>1-2
Moderate Pollution
1
>0-1
Weak to Moderate Pollution
0
<0
Absent to Weak Pollution

Uranium Geoaccumulation Index
0-1
2
5
1
2
3
Mu
ltiplicatio
n facto
r of 1
Hazard Map Calculation
Class
PF
PF-ponderation factor

Hazard Map Distance of uranium mines to land use
categories
Calculation
Class
PF
(Land use categories X 10000)/Distance to uranium mines
0 - 20
20 – 40
40 - 60
1
2
3
Mu
ltiplicatio
n facto
r of 1
PF-ponderation factor
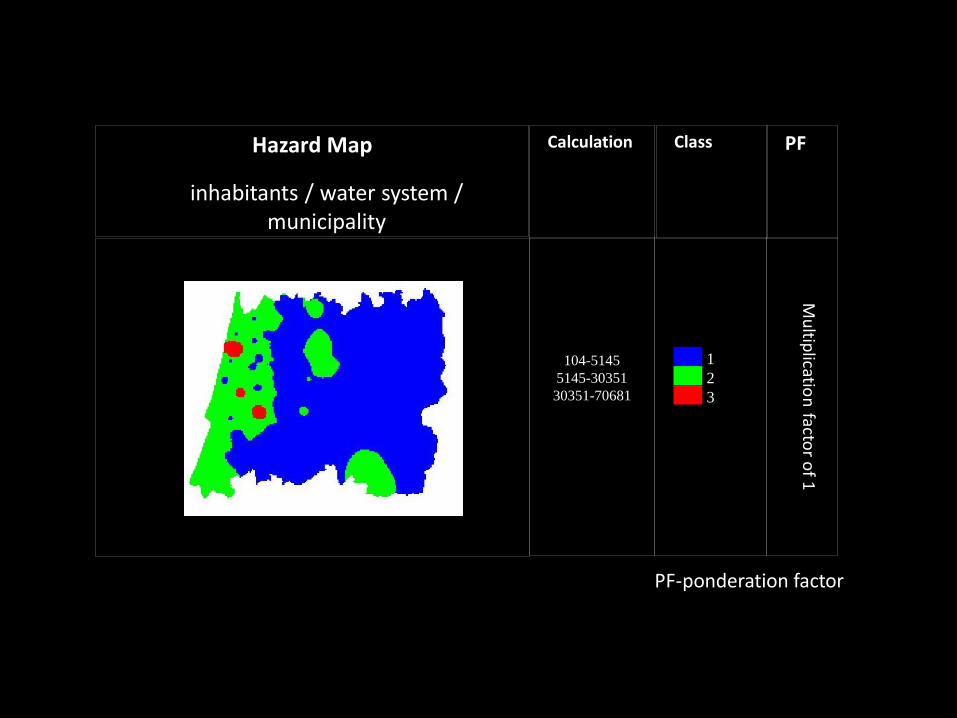
inhabitants / water system / municipality
104-5145
5145-30351
30351-70681
1
2
3
Mu
ltiplicatio
n facto
r of 1
Hazard Map
Calculation
Class
PF
PF-ponderation factor

Water system / municipality
1-10
10-20
20-76
1
2
3
Mu
ltiplicatio
n facto
r of 1
Hazard Map
Calculation
Class
PF
PF-ponderation factor

Lithology
1-
limestones 2-
sandstones shales and quartzites 3-granitic
rocks
1
2
3
Mu
ltiplicatio
n facto
r of 1
Hazard Map
Calculation
Class
PF
PF-ponderation factor

Natural Gamma Ray
m-1s e m-2s m e m+1s
m+2s e m+3s)
1
2
3
Mu
ltiplicatio
n facto
r of 1
Hazard Map
Calculation
Class
PF
PF-ponderation factor

Type of U ore waste Class Type mine
Clas
s Leaching Class
Acid
water Class
waste rock < or = 20000 (tons) 1 open pit 2 Yes 5 Yes 5
waste rock > 20000 (tons) 2 underground 1 No 1 No 1
waste rock > 1000000 (tons) 3 Both works 2
poor ore < or = 2000 (tons) 3
poor ore > 2000 (tons) 4
poor ore > 1000000 (tons) 5
rejected from treat < or = 2000
(tons) 3
rejected from treat > 2000 (tons) 4
rejected from treat >1000000
(tons) 5
Type of mines classification

Classification of exploited mines
Low volume of
waste+underground
mine+no leaching+no acid water
Medium
High volume
of waste+open
pit+leaching+acid water
1
2
3
Mu
ltiplicatio
n facto
r of 1
Hazard Map
Calculation
Class
PF
PF-ponderation factor

Combined Hazard Potential
• Lithology + Gamma Ray Exposure
• Distance from uranium mines to land use categories +
U Geoaccumulation Index in stream sediments
• Number of water systems per municipality + Inhabitants per water system.

Combined Hazard Potential

Conclusions
• Gamma ray exposure rate was an important indicator.
• Further development will include vulnerability indicators.
• Previously used vulnerability indicators were not possible to use due to the reduction in the unit from the NUTS unity to the pixel (100x100m).